[Update: Videos about images on the handheld and what can be done with the TI-Nspire Navigator are now available on youtube. To transfer a file that you inserted an image on from the computer to your handheld, try this video tutorial. The basic insert image tutorial is here.]
Diagrams and pictures can help student engagement and exploration. The TI-Nspire Navigator 3.0 makes it easy to evaluate students in engaging ways. It encourages a new means for students to communicate their explanation of the relationship between their mathematical model and an image. This extends their learning beyond the normal rote problem set into an interactive investigation. Today in class I used the last image in this blog entry, the NASA Space Shuttle launch, to see how well students could write an equation of a line. They said they wish their previous math teacher could have used this. It would have helped them learn and understand slope and y-intercept so much better.
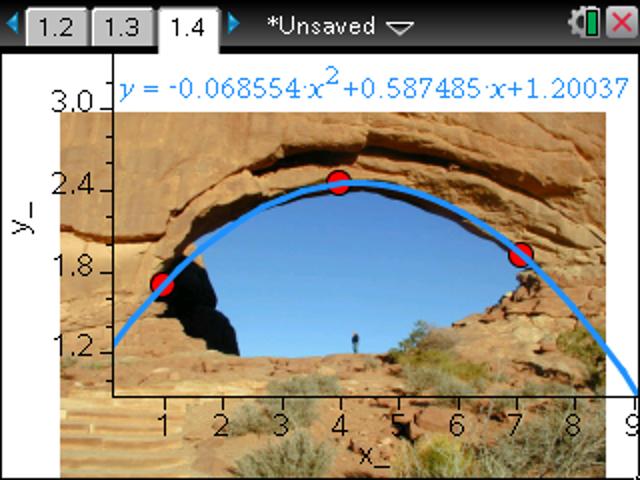
 Images appear crisp and bright in vivid colors on the TI-Nspire CX. It comes with some images already loaded in the TI-Nspire, Images folder. But it is easy to import more jpeg, bmp, png, or clipboard (YES, copy/paste works) images. Any of these work just as well as the other from my experience. For more info about the file types you can read a recent google group conversation. I really enjoy copy/paste. It has been recommended to not use a several megabyte picture, but to keep the file size small. I've used images on a QuickPolls with the Navigator and it took it a second or two for the students to get the question to pop up on their screen rather than the normal nearly instantaneous delivery. But it was worth it.
So how do you insert a picture or image into a TI-Nspire document? It is essentially and easy and clicking 'Insert.'
From the software, images can be put into Questions, Notes, Graphs, Geometry, and Data & Statistics applications by clicking the 'Insert' button and choose 'Image...'.
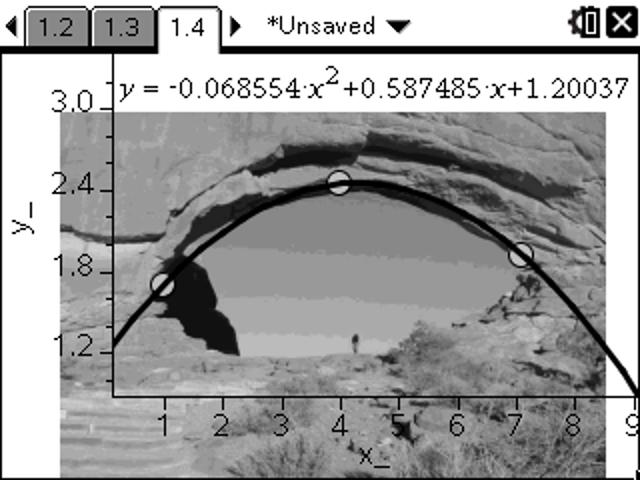
Images convert from color into grayscale well on the Touchpad or Clickpad handheld devices.
The screen shots you see can be found in the 3.0 OS TI-Nspire document here.
All text and lines are mapped to black.
Here is an example from Data & Statistics page. Images can be modified by moving them, change the size but keeping the aspect ratio, squish or stretch vertically or horizontally. Again, on a D&S page select the image by pressing menu, Action, Select Image.
 So there is currently not a way to rotate an image or adjust the transparency. However, there is a way to make an image more transparent on a Graph and Geometry page with the following trick.
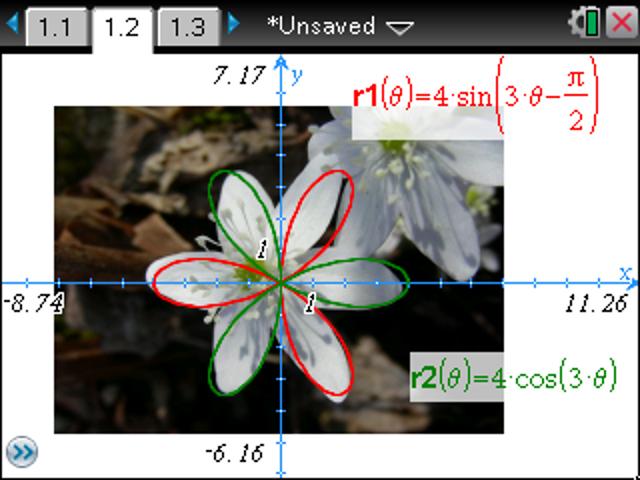
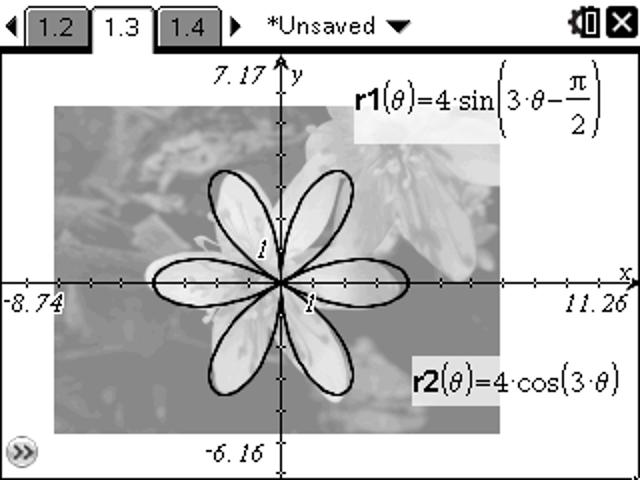
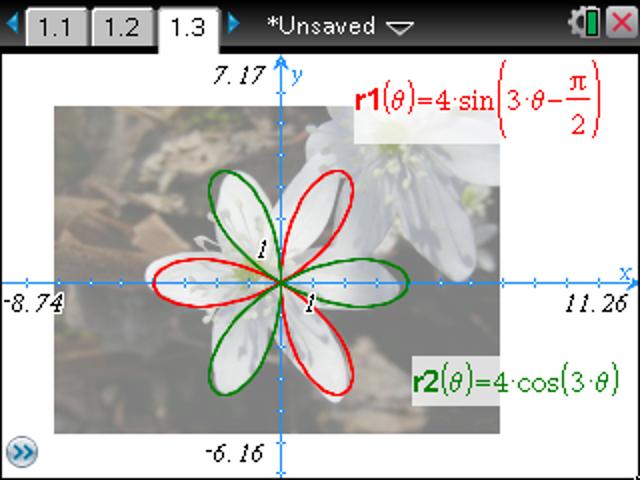 Note page 1.3 looks like the image is more transparent. Actually what happened is the image was inserted on a Geometry page, THEN the view (press menu>View) was changed to Graphing. This puts a somewhat translucent graph on top of the Geometry View. Similarly you could Show an Analytic Window on top of a Geometry page. This is what it looks like on a TI-Nspire Touchpad.
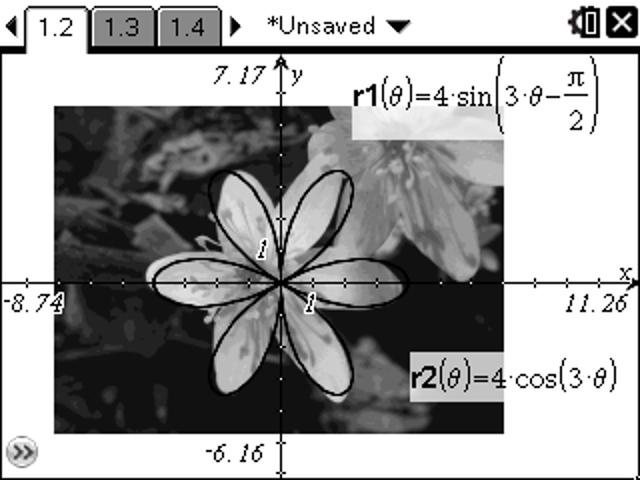
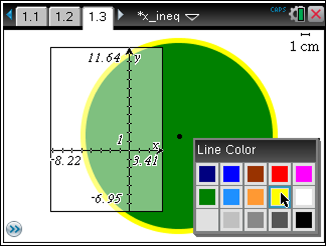
 For this OS we do have color, but we are limited to 9 vibrant choices.
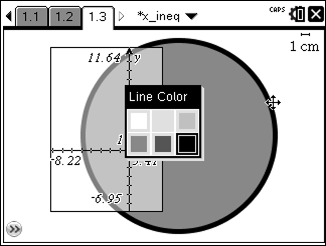
 If you want to have images as part of a question, especially for doing Activity Center-like questions where equations are put on top of images, instead of doing a split screen, use the question type “Equation.” You can choose y= or f(x)= and change it later under ‘Response Type.’ Check the box for ‘Include a Graph Preview’ in order to make a question that will have some extra ease-of-use features. As the example below demonstrates, the student only needs to start typing in the equation and the graph appears and automatically updates. Again, this works when it is a Quick Poll or if it is part of a document.
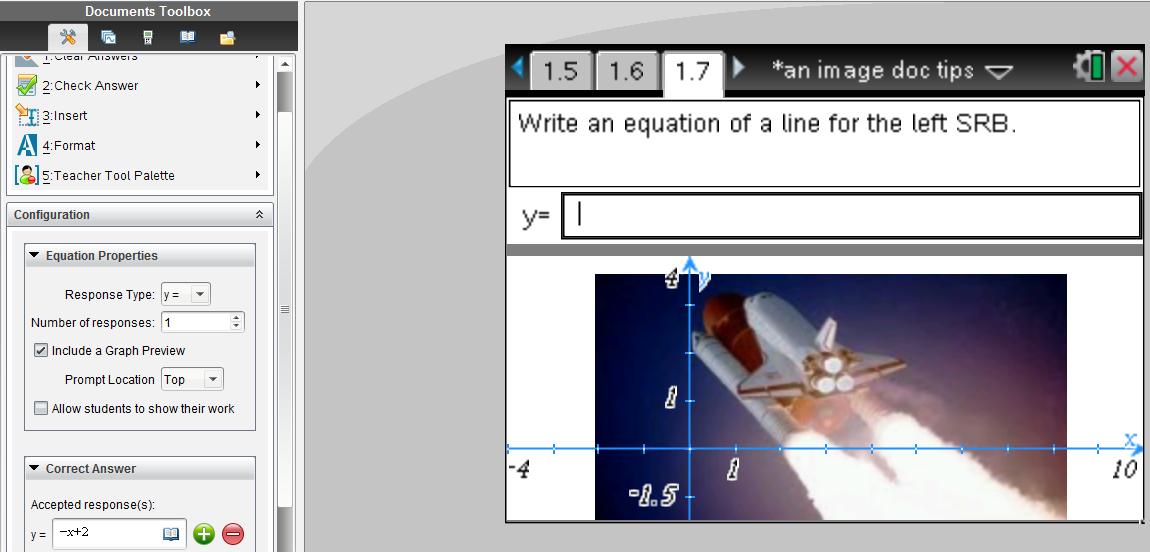
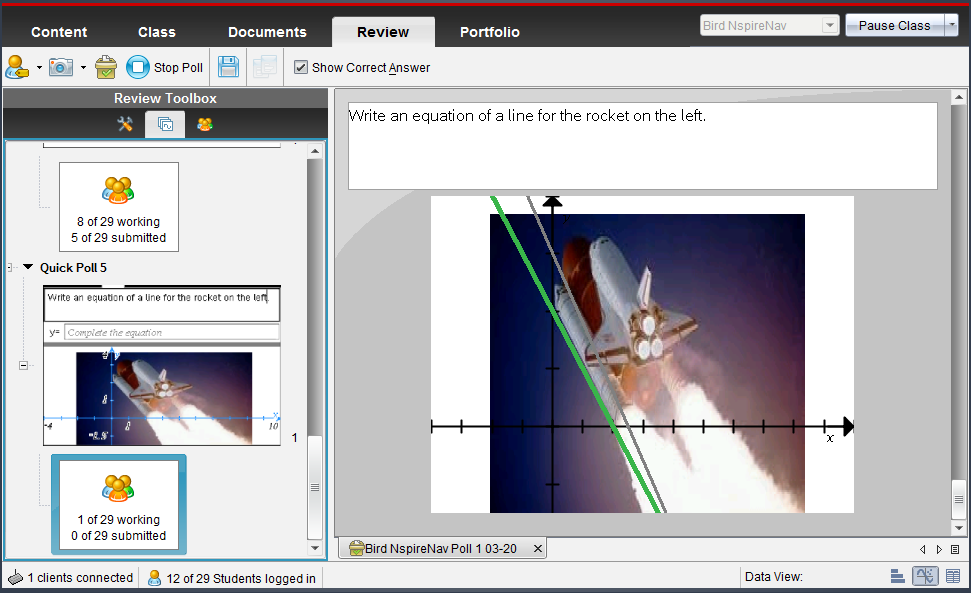 Notice the ‘Data View’ options on the bottom right of the Quick Poll. If Graph is chosen, the image appears and students’ contributions are shown when they press enter.
Gray is the default color for students and green is the correct answer. Under the Review Toolbox is a wrench and hammer. By clicking this Tool and choosing Graph Tools, Individualize Student Responses can be activated.
 * * |  * * |
I know the summer workshops will give more hands on experience with images and tips for the use of color. The Connecting Math & Science workshop in Indianapolis (among other places) will also share some updated colorful files to help encourage students toward STEM careers. They will also have colorful 3.0 Nspire files for some NASA activities.