Wednesday, April 6, 2011

Inserting Images on the TI-Nspire

Abstract (That means summary, 'cliffnotes' version for those who are don't like to read the interesting details.): How do you insert an image onto your TI-Nspire handheld? 1st, you need to install your software that comes with the purchase of TI-Nspire. No software? You can get the 30-day trial from TI's website. 2nd, open a document and choose an application like Notes, Graphs, Geometry, or Data & Statistics as shown in the image below. 3rd, click Insert, Image. Pick an image. With your TI-Nspire handheld attached to your computer, you can save the document to your handheld.

[Update: Videos about images on the handheld and what can be done with the TI-Nspire Navigator are now available on youtube. To transfer a file that you inserted an image on from the computer to your handheld, try this video tutorial. The basic insert image tutorial is here.]

Diagrams and
pictures can help student engagement and exploration. The TI-Nspire Navigator 3.0 makes it easy to evaluate students in engaging ways. It encourages a new means for students to communicate their explanation of the relationship between their mathematical model and an image. This extends their learning beyond the normal rote problem set into an interactive investigation. Today in class I used the last image in this blog entry, the NASA Space Shuttle launch, to see how well students could write an equation of a line. They said they wish their previous math teacher could have used this. It would have helped them learn and understand slope and y-intercept so much better.

Images appear crisp and bright in vivid colors on the TI-Nspire CX. It comes with some images already loaded in the TI-Nspire, Images folder. But it is easy to import more jpeg, bmp, png, or clipboard (YES, copy/paste works) images. Any of these work just as well as the other from my experience. For more info about the file types you can read a recent google group conversation. I really enjoy copy/paste. It has been recommended to not use a several megabyte picture, but to keep the file size small. I've used images on a QuickPolls with the Navigator and it took it a second or two for the students to get the question to pop up on their screen rather than the normal nearly instantaneous delivery. But it was worth it.

So how do you insert a picture or image into a TI-Nspire document? It is essentially and easy and clicking 'Insert.'
From the software, images can be put into Questions, Notes, Graphs, Geometry, and Data & Statistics applications by clicking the 'Insert' button and choose 'Image...'.


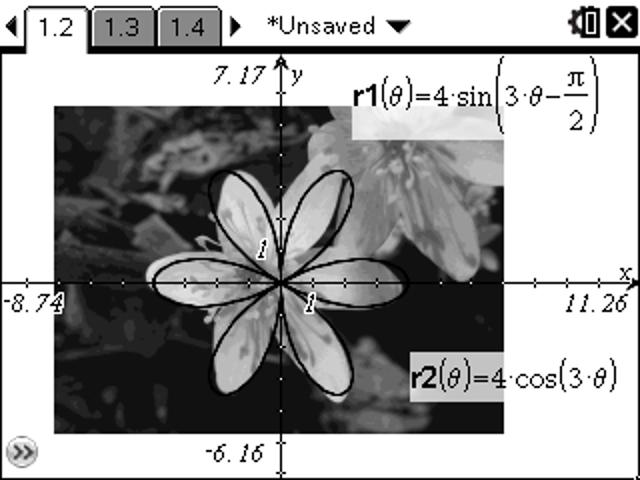
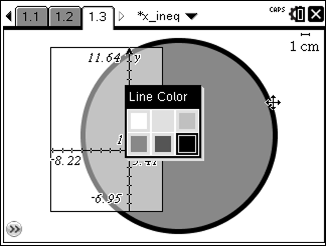
Images convert from color into grayscale well on the Touchpad or Clickpad handheld devices.

The screen shots you see can be found in the 3.0 OS TI-Nspire document here.

All text and lines are mapped to black.

Here is an example from Data & Statistics page. Images can be modified by moving them, change the size but keeping the aspect ratio, squish or stretch vertically or horizontally. Again, on a D&S page select the image by pressing menu, Action, Select Image.
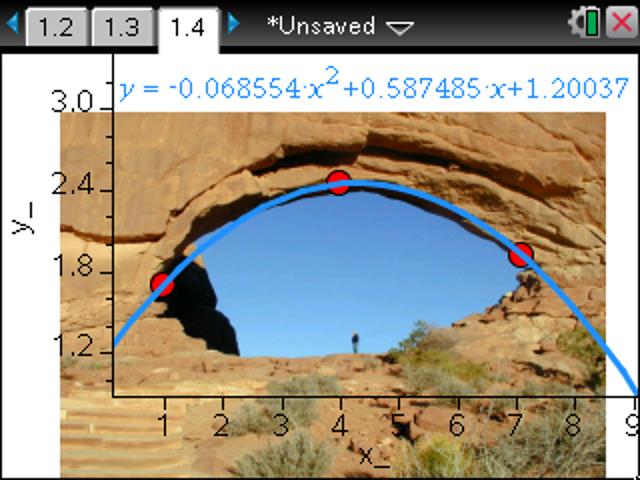
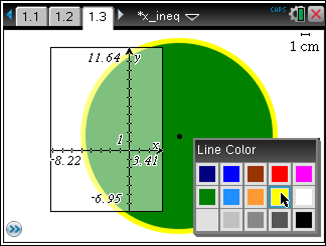
So there is currently not a way to rotate an image or adjust the transparency. However, there is a way to make an image more transparent on a Graph and Geometry page with the following trick.
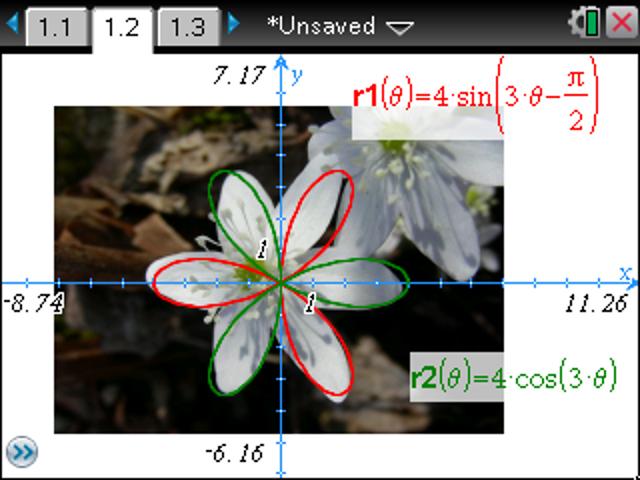
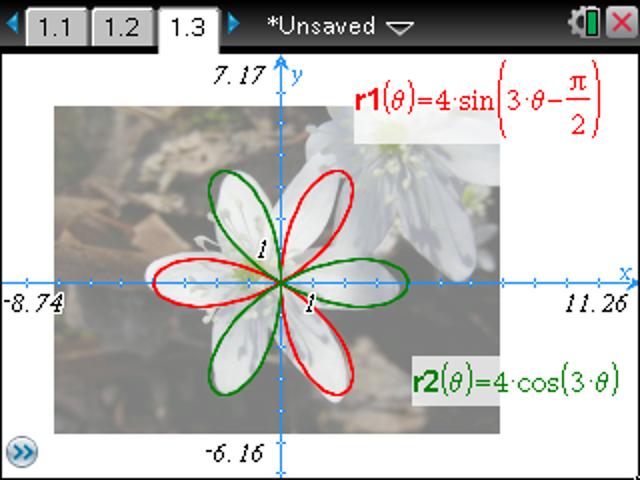
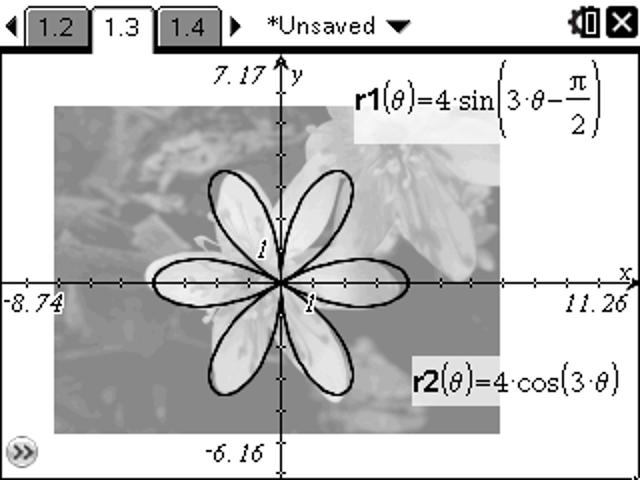
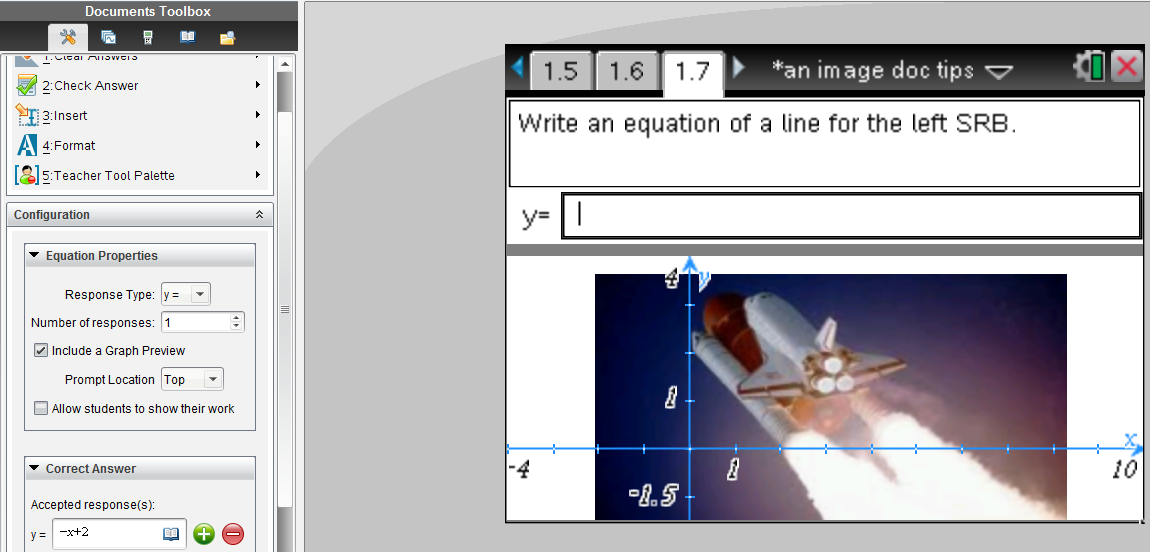
Note page 1.3 looks like the image is more transparent. Actually what happened is the image was inserted on a Geometry page, THEN the view (press menu>View) was changed to Graphing. This puts a somewhat translucent graph on top of the Geometry View. Similarly you could Show an Analytic Window on top of a Geometry page. This is what it looks like on a TI-Nspire Touchpad.For this OS we do have color, but we are limited to 9 vibrant choices.If you want to have images as part of a question, especially for doing Activity Center-like questions where equations are put on top of images, instead of doing a split screen, use the question type “Equation.” You can choose y= or f(x)= and change it later under ‘Response Type.’ Check the box for ‘Include a Graph Preview’ in order to make a question that will have some extra ease-of-use features. As the example below demonstrates, the student only needs to start typing in the equation and the graph appears and automatically updates. Again, this works when it is a Quick Poll or if it is part of a document.
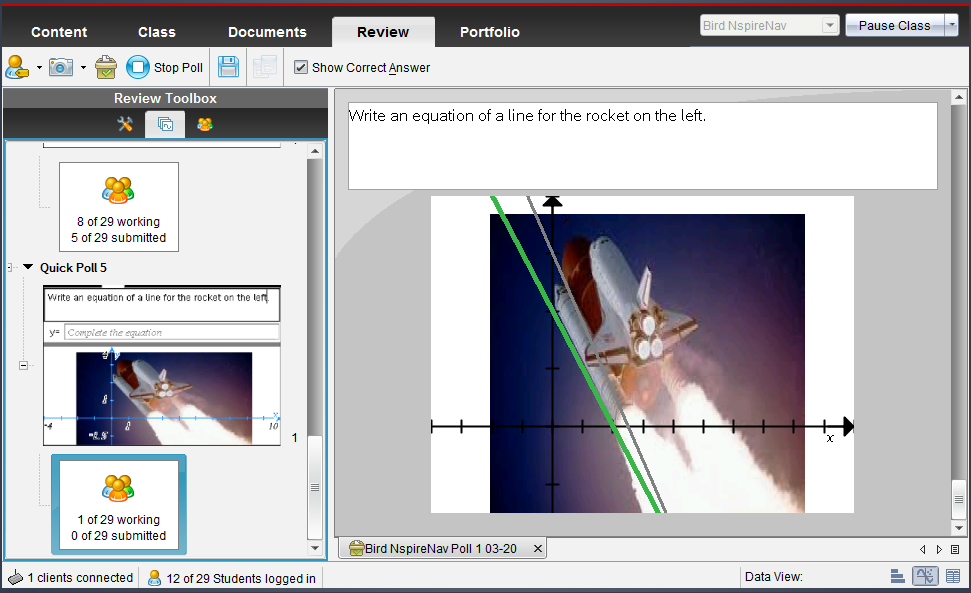
Notice the ‘Data View’ options on the bottom right of the Quick Poll. If Graph is chosen, the image appears and students’ contributions are shown when they press enter.
Gray is the default color for students and green is the correct answer. Under the Review Toolbox is a wrench and hammer. By clicking this Tool and choosing Graph Tools, Individualize Student Responses can be activated.


**
Another tip in regards to colorful images: Sometimes changing the color of the axes and the line will be beneficial for the students to see their graph. Type something into the y= box and change the attributes and color.

I know the summer workshops will give more hands on experience with images and tips for the use of color. The Connecting Math & Science workshop in Indianapolis (among other places) will also share some updated colorful files to help encourage students toward STEM careers. They will also have colorful 3.0 Nspire files for some NASA activities.

Monday, April 4, 2011

TI-Nspire Lab Cradle: Part 2

Update: There is a Motion Lab/activity that can serve as a nice introduction to the CBR2 available at this link.
This is an exciting time. I would say that with the use of the TI-Nspire Lab Cradle the number of probes/sensors that can be used nearly doubles. According to a Vernier website the number of available sensors if you are using the Easy Link or Go Link are 50 and with the Lab Cradle it is 58. However, let's say you have some old sensors in the stock room that you thought you would never get to use again. With the right adapter, I have now tested an old accelerometer, pressure sensor, a microphone that was designed for the CBL, and just today I received the Motion Detector Cable MDC-BTD and got the original CBR to collect data as shown in the picture. (Thanks Grant, a top AP calc & physics student, for having your camera and taking the pic.) So the $145 TI-Nspire Lab Cradle can be a really good deal if you have some older equipment. Potentially hundreds of dollars of resources can now be used again and you won't need the approximately $60 Easy Link.

[Update: I've used the Easy Link with the older equipment with great success. Note that there are several data collection sensors like the microphone, photogates, and motion that will not work with the EasyLink's one 'BTA' port, but need the Lab Cradle's 'BTD' ports. The Lab Cradle also has 3 places to plug in 'BTA' plugs so you can, for example, measure temperature of 3 things at the same time like we've done with this evaporation lab.]

Now to the question about 'what data collection equipment should you get?'
If I was consulting your school and helping you develop a plan that fit your teachers, I would begin by asking several questions. But since we aren't having that dialogue, I'll give a general response.

If you don't have any sensors, and you have less than $150, the two data collection probes that all schools ought to have for science and mathematics would be the temperature probe and motion detector - Easy Temp and CBR2.
Neither of these require an additional interface. You can plug them directly into the mini USB on the top of the TI-Nspire. Similarly, if you have have a $5 mini to standard USB adapter, then you can plug a Easy Temp ($38) or CBR2 ($93) into your computer and the Nspire software will auto-detect and begin collecting data.

The gas pressure sensor is another one that (along with Easy Temp) is especially useful in bio, chem & physics.

I was recently asked what sensors I would recommend for an environmental class. Take a look at the recommended probes with the lab book "Investigating Environmental Science through Inquiry." Instruction are provided for pH, conductivity, soil moisture, O2, UV sensor (this appeals to many classes), light sensor (I bet you have that one from your CBL days), etc.
Most of these work with the Easy Link. But you cannot use the microphone with the Easy Link.

That is why I'm so excited about the Lab Cradle: multiple probes, extended battery life and help to power probes with the built in rechargeable battery, AND more sensors that I have been wanting to use.

I think math and physics teachers will be especially excited by the microphone. With a tuning fork you get real-world sinusoidal data that gives audible significance to the general equation y=A*sin(B*x)+C, where B=2pi*frequency or 2pi/T, the period. In mathematics they tend to call the coefficient in front of the x-variable B, but especially when dealing with rotational motion, like a Ferris wheel, I prefer to call it omega, the angular velocity. We used a 512 Hz tuning fork to get the data shown in the screen capture. The curve fit gave a value of 511.7 Hz. I love it!

[Update: Microphone lab with the TI-Nspire and many more are now available from Vernier.]

In addition to the microphone, with the Lab Cradle the 3-axis accelerometer, photogate, nuclear radiation monitor, and rotary motion sensors are new comers to the Nspire family that will be useful for mathematics and science classes.

Tuesday, March 29, 2011

TI-Nspire Lab Cradle: Part 1

I just got back from a great T^3 STEM Conference in the Atlanta area. It was a blast* sharing "Colorful ConneXions" between math and science with the TI-Nspire CX CAS. (*Yes, I did show a video of the blast off of a recent Space Shuttle launch and gave links to NASA TI-Nspire activities, like this Alg 1 activity.) These CX sessions had an excellent mix of teachers and technology coordinators, including physics, physical science, calculus, and algebra instructors. One participant from Florida, who I hope to see at a Summer Workshop, wanted the session to keep on going because he enjoyed it so much.

Some of the participants were excited to learn about the new Vernier DataQuest application and wanted to know more about the TI-Nspire Lab Cradle, like how much it costs. For the participants who were familiar with Vernier's Logger Pro, they felt right at home with the DataQuest. They were pleased with the options available, like the built-in Motion Match, along with the versatility of the functionality.

Regarding connecting sensors, to use one CBR2 or an Easy Temp you do not need any interface device. Plug it in and you are ready to go and have students make discoveries and connections about slope, sinusoidal cures, parabolas and more. Two of my students won a trip for themselves and me to the Kennedy Space Center for their research and presentation regarding parabolas with the motion detector. (Here is the press release from last year.) Teachers will appreciate that you can just plug in the motion detector and click the green start collection button to get the position-time and corresponding velocity-time graph simultaneously.
Update: With OS 3.6 in December 2013, you don't need to move your cursor or press TAB to get to the green start collection button. It is active and ready for you to press Enter to begin collecting data. 

By pressing menu, Analyze, Tangent (derivative) or Integral, calculus classes will find themselves easily making real-world connections.

The Easy Link, an interface between one probe and the TI-Nspire handheld, enables you to plug into a good number of sensors. It costs $59. However, you are still limited to one sensor unless you plug into a computer. You can connect as many sensors as you have USB ports and Go! Links.

Data collection is extremely fast and easy when you do two sensors at the same time. Currently this can be done with the old TI-Nspire Navigator Cradle or with the software.
Now with the TI-Nspire Lab Cradle you can connect the mini-USB port on the top to the USB of your computer (no TI-Nspire handheld required) and enjoy demonstrating data collection with the 3 analog (for most sensors, including voltage, pressure, etc) and 2 digital (like for the CBR, microphone, rotary motion sensor, etc) channels.

Some examples of data collected with two sensors include: 

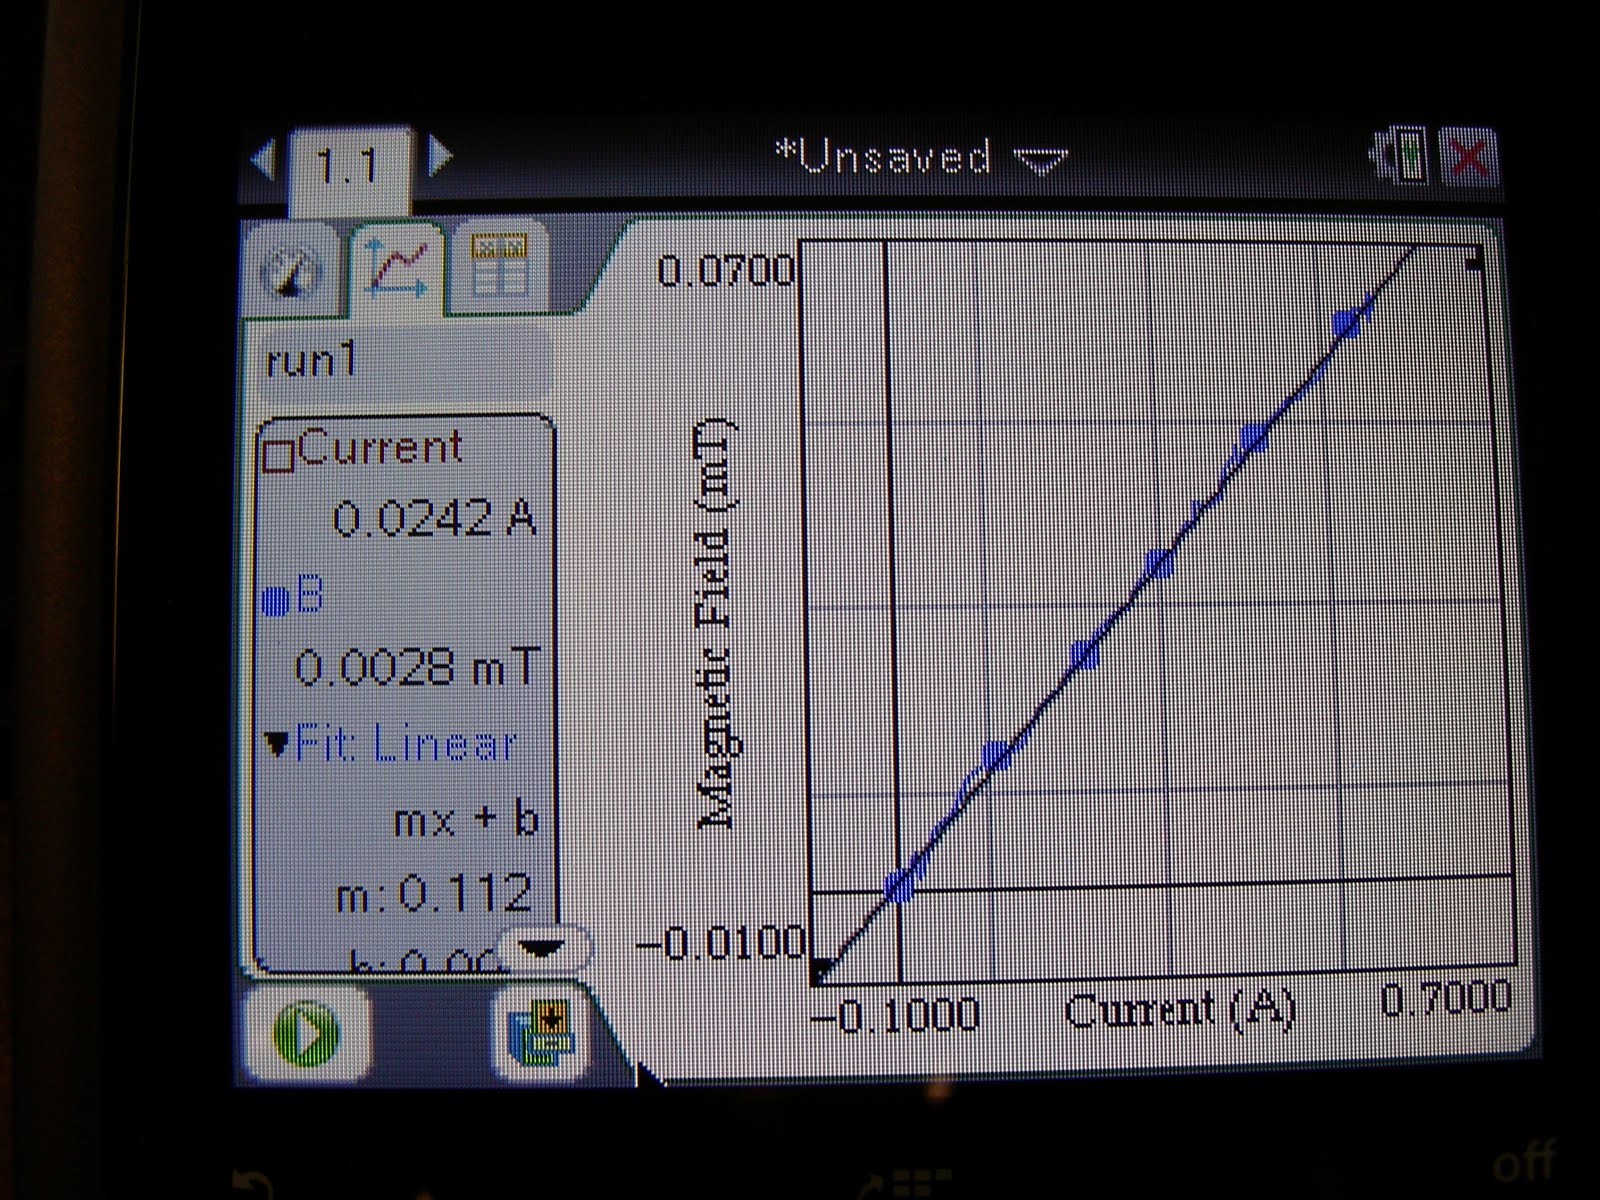
- Magnetic Field Sensor, current probe, and a slinky to get great linear data
- magnetic field sensor and motion sensor for distance for an inverse relationship
- light intensity and distance - an inverse square law relationship
- voltage and current - the slope of this linear data is resistance, based on Ohm's Law.

With the Lab Cradle you will even be able to plug in two CBRs if you have a mdc-btd cable. Students can then investigate motion parametrically. One motion detector can be oriented in the x-direction and the other in the y.

YES, you read that correctly. With the Lab Cradle you can use the old Vernier probes and sensors you've had in a science storage room or mathematics teacher's closet. This includes the CBR! I'll try to share more on this and include pictures this next week.

Also, the TI-Nspire Lab Cradle is like getting 3 Easy Links plus a lot of things you couldn't get or do with the Easy Link. So in that regards the $145 doesn't seem so bad. Especially if you got the 5-pack bundle that comes with a 5-unit charging bay, that would be enough for just about any class size. With the experiment set up, every student could collect the data on their own Nspire.

In a similar price range is Vernier's LabQuest Mini. It is $149. With that you will need a computer with Logger Pro or Logger Pro Lite. Of course with the Lab Cradle you need a TI-Nspire OR a computer with Nspire software (http://www.vernier.com/calc/ti-nspire/interfaces-and-sensors.html).
Vernier's stand alone device is LabQuest. This impressive colorful touchscreen device is $329, but it comes with the emulator software.

So if your school, or even if it is just you using the TI-Nspire Software, or if you have some students with the TI-Nspire, what should you get?

I'll try to answer this in more detail next time...

Tuesday, March 15, 2011

What does CX stand for?

In the effort to achieve success in the classroom through the appropriate use of technology the CX brings some exciting improvements. Just yesterday I had a student ask what does the CX stand for in TI-Nspire CX. So here is my response to this question.

C is for color or colour for those outside the U.S. And what might the X stand for? Well,
eXtra color obviously. Or perhaps it suggests that it is
eXciting and new. As you can see from picture, it is
eXtra thin. It is flatter than many cell phones. I put it on the table next to a blackberry and they were about the same thickness. It is
eXtra bright. With the backlit screen it makes it so much easier to read then its predecessor. The screen is so crisp and clear, students have commented that it is a better screen than their cell phone. Many teachers will especially enjoy that it has
eXtra battery life. No longer will teachers or students need to replace the AAA batteries. It doesn't use any. It can run for weeks without needing recharged. When it does need recharged, this can be done with the wall charger that comes with the purchase, or the mini USB can be connected via a wire to the USB of a computer, OR it can be docked into a CX docking station, OR it will be charged from the Navigator cradles. Another extra is
eXtra memory. When I turn on my TI-Nspire CAS Touchpad and look at the status it says it has 27.8MB; the TI-Nspire CX CAS has 115.2MB. Maybe the X stands for
eXpandable. There is a special CX TI-Navigator Wireless Network Adapter that is yellow and sits atop the CX. This plugs into the new port on the top and has little metal 'grips' that are secured in the groves on the side. Our school has purchased through a couple of distributors over the past years, including Bach Company and School Mart. The latter says the CX Navigator hardware will be ready to ship in May. Another way to expand the TI-Nspire CX is with the Vernier Lab Cradle. This tool which will be available in April will enable data collection in ways that were not previously possible. Finally, I suggest that the TI-Nspire CX is
eXtra nice, because it plays well with others. The Lab Cradles work on any TI-Nspire. If you already have the TI-Nspire Navigator, those cradles fit really well on the CX and you can have a mixed class of Clickpads, Touchpads and CX. However, I would recommend only having a class of Touchpads or CX because all the buttons are in essentially the same location. I've heard many teachers and students who first get their hands on the CX exclaim how much they like the button on the new CX. They also quickly notice the responsiveness of CX's touchpad. That's right, it still uses the touchpad and is not a touchscreen. This means that it is still allowed on all the major tests. The TI-Nspire CX CAS is permitted on the PSAT, SAT, AP exams like AP Calculus, AP Statistics, AP Physics, AP Chemistry, etc. In addition to the above, the numeric TI-Nspire CX is permitted on the ACT and IB exams.


For those wondering, 'What is this information about a graphing calculator doing on a Godly Dominion blog?' I would answer both you and myself that technology, especially educational technology that seeks to "inspire all students to achieve to their potential and become innovators of tomorrow," is an integral part of the cultural mandate, or the dominion mandate, in Genesis 1:28.

And in the words of one of history's greatest mathematical physicists,
“Almighty God, who hast created man in Thine own image, and made him a living soul that he might seek after Thee and have dominion over Thy creatures, teach us to study the works of Thy hands that we may subdue the earth to our use, and strengthen our reason for Thy service; and so to receive Thy blessed Word, that we may believe on Him whom Thou has sent to give us the knowledge of salvation and the remission of sins. All which we ask in the name of the same Jesus Christ our Lord.” - James Clerk Maxwell (1831-1879)

Saturday, March 12, 2011

TI-Nspire CX at T-cubed in San Antonio

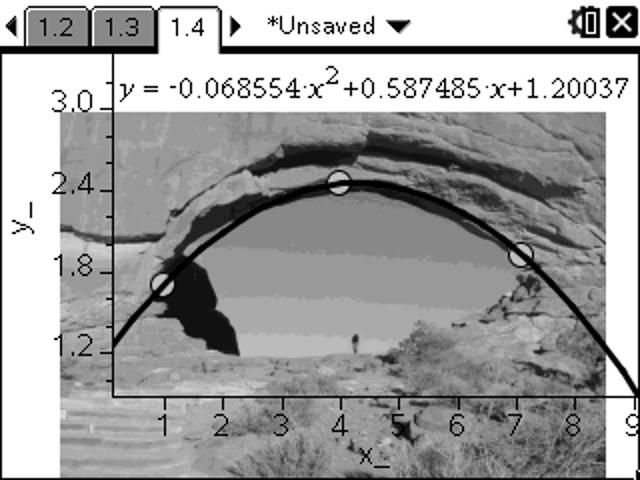
At the recent Teachers Teaching with Technology International Conference in San Antonio, I had a great time seeing friends and new technology that will be a blessing to the math and science classroom. There have been questions about how clear is the CX color and backlit screen. To the right you can see a picture I took with my camera. The picture of the flowers were taken by my daughter Lydia in our backyard. This gives new meaning to graphing and rotating a polar 'rose.'

Inserting images makes mathematical modeling a lot more fun. I was showing the picture of the Alamo with the equations on it to a TI-Nspire Online User Group (The next meeting is April 14.), when someone asked about how the circle was draw. When you are on a Graphs or Geometry page you can press menu > Shapes > Circle.
After the circle is draw, you press menu > Actions > Coordinates and Equation and click the circle to show the equation of the circle. I like to move my cursor over the circle and press ctrl menu for right-click and choose Coordinates and Equation. Showing the coordinate or equation is a feature that can be turned off by teachers who do not want students to have access to this. To do this they would use Press-to-Test.

Not that too many high school teachers use 3D by graphing z(x,y), but there is definitely a lot of excitement about this functionality on the TI-Nspire. It is so much more powerful than what was available with the TI-89. When z1(x,y)=x^2+y^2 is entered in the 3D graph view, a paraboloid is almost immediately rendered. This used to take a lot more computing time on the 89. Then something the 89 couldn't do, graph another 3D graph on top of that and z-trace. Auto-rotate by pressing A or just use the arrows.
Here is a video of a 3D graph that is rotated. I guess I need a better video camera if I want to do any future videos like this. To the right is a much better picture of what the heart looked like on the TI-Nspire CX handheld. (Here is a link for more graphs of hearts.) I was showing this to some middle school students last night. My oldest daughter was begging me to show her friends the CX. Some of her basketball teammates were spending the night on Friday before they went on a service project on Saturday morning. This group of girls said they had never heard of a z-axis. By easily changing the orientation of the axis by pressing x, y, and z or rotating using the arrows, it was fun to watch the 'light bulbs' turn in in their minds. They were so excited about math and learning some things their teachers hadn't taught them. They were exploring and explaining to each other what the z-axis was. With color, images, and fun 3D shapes, math becomes a lot more cool, even for 8th grade girls at a sleep over.

Yes, 3D and the new differential equations graph type, now enabling the drawing of slope fields from anywhere - even the Scratchpad, will be features that are available for the CAS or numeric TI-Nspire or TI-Nspire CX when they upgrade to 3.0.

Saturday, February 26, 2011

Handheld Graphing Calculator in Color

As I was driving home the other day I heard a song on the radio that begins with, "Looking for a color in a shade of gray."

God created a very good and colorful world. Heaven will be a world of colors. However, many inventions in the past century or so started out in black and white.

The first permanent black and white photograph was taken in the 1820s. And although my favorite mathematical physicist James Clerk Maxwell made the first permanent color photo in 1861, black and white prospered well into the 20th century. I was interested to learn how many famous mathematicians and scientists were involved with the discovery of photography: Aristotle and Euclid described the pinhole camera in the 5th & 4th Century B.C., the name camera obscura is attributed to Kepler; Boyle and Hooke developed a portable camera in the 1660s.
Kodak came out with the modern color film in 1935, but due to expense color snapshots didn't become common until the 1960s and it became the norm in the 1970s.

Black and white television shows were first regularly broadcast in 1928.
RCA sold color TVs in 1954 for $1000. When Disney aired episodes of the Wonderful World of Color from 1961-1969, my Mom and her sisters enjoyed watching it even though they still only had a little black and white tube in the house. In 1972 the sale of color televisions exceeding that of black and white. I grew up watching the color test bars before the cartoons started.

Graphing calculators first came into my world in the late 80s. A little over twenty years later and it is now 2011. This is a historic year. Texas Instruments started selling a handheld graphing calculator that brings color to a world that was once only black and white (with some shades of gray these past few years).

WOW!

There were some things my students could enjoy with color only if they had installed the software that comes with the purchase of a handheld. Now, if they buy the TI-Nspire CX they will be able to enjoy the wonderful world of color in math and science wherever they are. A great thing is how much content is ready to use with color and more will be coming out throughout the summer. It will be a good year to participate in a summer workshop. In addition to being equipped with a lot of classroom-ready content, teachers will get a TI-Nspire CX or TI-Nspire CX CAS handheld and Teacher Software. If teachers choose a 'Connecting Math & Science' professional development workshop, then they will learn about all kinds of applications that will add relevance to what they are teaching. One of these workshop will be in Indianapolis. Click here for more details about this and others.

I've had opportunity to play with the CX recently. Look forward to more details about what I've discovered.

Saturday, February 5, 2011

Why I Nspire? Part 4 - MathPrint

To recap the reasons already given why I use the TI-Nspire for teaching math and science:
#1 is because of the research,
#2 the value gained because the handheld comes with similar software,
#3 the TI-Nspire and TI-Nspire CAS are accepted on major exams.

Some of the first things I noticed and reasons for adopting the Nspire back in 2007, are the following:
#4) MathPrint. This has been a native feature of the TI-Nspire since it first came out that enables you to enter mathematical expressions they way they look in your textbook or homework paper. Students (and teachers) make fewer mistakes. You don't get lost in parentheses and carats. The TI-89 had what they called Pretty Print on the output so you could look to see if you typed it in correctly after you press enter. But the TI-Nspire has it on the input as well as the output. Instead of entering 'abs(((x^2-3x+2)/(x-5))^3)|x=-3' or 'int(sqrt(sin(x)),x,pi/2,pi)',

the Math Template palette can be used to select the desired template. The button to activate this looks like the absolute value and system of equation template. For helpful tips/reminders of what each template is used for you can use the Catalog. This button is just to the right of the Math Template button and looks like a book. Then press the number that corresponds to what you want to explore. For example, the image picture to the right is a screen capture taken from a TI-Nspire CAS software, so 1 is the alphabetical catalog, 2 the catalog by subject, 3 units (special built-in CAS feature), 4 symbols, 5 Math Templates, 6 Library.
For many of these there are short cuts: For the fraction template I would press ctrl obelus (the division symbol ÷). For exponents all you need to do is press the carat (^). Square root is the inverse operation of squared so it is activated by pressing ctrl squared. Seriously, I was so excited about this! The square root goes over everything it is supposed to. It had bothered me that the TI-84 even allowed sloppiness with parentheses. You did not need to close parenthesis. With the Nspire, if you ever open parentheses, there will automatically appear a close parenthesis.
Note that you typically enter characters as you would write them, instead of reverse Polish notation or RPN. So if you want to square x, first press x and then the x² button. For nth root, I would press ctrl ^. Euler's number raised to a power has its own button. Logarithm template is initiated by pressing ctrl 10^x. Some of the other templates can be found under menu. In fact, there are wizards that can help with fill in some of the syntax and pick the template. Press menu > Algebra > Solve a System of Equation, if you choose to solve a system of two linear equations with x and y as the variable, then you just press enter and everything except your equation will be populated.
To move from one equation to the next I like to use the tab button. With the TI-Nspire CAS, computer algebra system, you can solve all sorts of equations. As the third line shows this can also be done on a numeric Nspire with the numeric solve or nSolve. If I had wanted the decimal approximation, I could have also pressed ctrl enter as you can see in the keypad below.

Another fun tip I share with my calculus students is that you can quickly access the derivative and integral by pressing shift + or shift minus. Which one do you think does which? Why does that make sense, at least for polynomials? If you really didn't want a definite integral, do not fret, just leave it blank. How about if you wanted to do a second derivative? Once you have the first derivative template, you could change your mind and decide to make it I higher degree by pressing the carat ^ and then the number you want.
I've got a couple of tips for working with matrices too. Let say you picked a 2x2 matrix and you decided that you really wanted a 3x2 matrix, just press the carriage return button on the bottom right, ↵. To add more columns, first press shift and then ↵. To delete a row or column, I would select it by pressing shift and the arrowing left, right, up or down and then delete.

To get to know the Calculator page more and enjoy MathPrint there is a modified Scavenger Hunt on my school's website that I've used to help Calculus teachers and that could be used as an exploration for students.

This past year, the TI-84 came out with an operating system that adopted some of these popular capabilities. In addition to Math Print, one of the features is about how the history is preserved. Previously the 84 could remember the last 10 entries. These entries were retrieved by pressing 2nd ENTER. You can now up arrow to a previous line and press enter to copy and paste that text into the the entry line. On the TI-Nspire it remembers a history of 99 input and output lines for each Calculator page, up to a maximum of 50 pages in each of the 30 problems allowed in a single document.
In the image to the left, you can see that I have arrowed up three out of the eleven entries (see bottom right) that are stored in the history on page 3 of problem 1 (see top tab) of this 'Unsaved' document.

Perhaps part 5 of the series will be about the better resolution and the dynamic geometry capabilities.

Thursday, January 13, 2011

Colorful Nspire Art

This year's J-term added a bit of color (or colour for my international friends) to their Graphing Art project. The picture to the left was done by Sarah who is quite interested in NASA. The stars are 'polar roses' translated vertically and horizontally using parametric and the truth that x=r*cos(angle) and y=r*sin(angle). The comet was animated. This may have partially been inspired by the brief NASA Now program we watched.

Since we became a NASA Explorer School we have also done a number of NASA activities including Exploring Space through Math's Weightless Wonder activity. The NASA Weightless Wonder Nspire file made it so they could do the activity paperlessly and with additional exploratory capabilities.

Another student whose brother attends Kettering did her picture of their mascot. Kettering is known for their co-ops which have even included co-ops with NASA. Besides the impressive quartic Kristen used for the head, I was also impressed with the oblique absolute value she used for the teeth - see the 22nd function f22(x). This activity definitely improves students' understand of transformations.

Kettering University mascot is the bulldogs.
As in previous years we did do a little data collection outside and may go out in the snow again tomorrow.

Monday, November 1, 2010

Why I Nspire? Part 3 -Exam Acceptance

There is a website that can visually display the frequency of word usage. I used Wordle.net to create the following word cloud for the TI website 'Top 10 Questions Parents Ask about Graphing Calculators".
Wordle: Why use a graphing calculator?The word cloud on the right was made by inputting this blog's website. This one appeals to me because it is like the fingerprint for this blog.

Now, for Part 3 in this series ...
One big reason that I made the switch from the TI-83/84 and TI-89 to the TI-Nspire CAS was because it is permitted on the AP Calculus exam. If it wasn't permitted, the decision would have been tougher. This question came up this past week on the AP Calc electronic discussion group.
I wrote that the TI-Nspire CAS's improved speed, math print or 'pretty print' on the input (and not just the output like with the 89), better pixels, and dynamic representations which make it easier to integrate graphical, numerical/tabular, algebraic, and verbal concept development are a few of the reasons we initially made the switch to the Nspire.

The TI-Nspire CAS can be used on all the College Board exams, like PSAT, SAT, AP (including AP Calc, Stats, Physics, Chem, etc.). The TI-Nspire is permitted on the ACT and IB tests, but CAS devices are not.

Today I learned of an exciting resource for IB teachers. "Written by Andy Kemp, a Head of Maths at an IB school in Somerset, the guide is specifically designed to help students understand how the TI-Nspire can be used as an aid to answering exam questions. The exemplar questions in this booklet are the author’s own work, and are written in the style of IB questions. Throughout there is as much emphasis on the mathematics as on the technology, as it is the author’s belief that without the focus on the mathematics, this guide would become little more than a button-pushing exercise."

I know from this website that the TI-Nspire is permitted on many state tests including TAKS. You could contact your local representative to get more info - for example for Texas see this link. Many state exams do not permit CAS.

Another summary of exam acceptance can be found at http://education.ti.com/educationportal/sites/US/nonProductSingle/assessments.html

There are a number of Test Prep resources and questions that can be used with the Navigator system to help students prepare for these high stakes tests.

If you want to learn more about this educational technology, this year the T^3 International Conference is in Texas. There is even a Calculus Conference-in-a-Conference track.

Technology tools

"Be still, and know that I am God..." Psalm 46:10
Two months ago an article appeared in our local paper. It was actually a devotion that was submitted by my pastor, Dr. Michael LeFebvre. I read a quote from this at a recent conference session that was focused on technology innovations in the classroom.

"A century ago, people thought that technology was going to make life less stressful. I have an old volume on my shelf called Achievements of Americans, published in 1859, that illustrates that optimism. Marvelling at the pace of innovation even then underway, the 19th century writers of that book exclaimed, “invention after invention crowd so thick upon us, that astonishment ... is only equaled by our wonder ... [at] the eventual result of all these ... upon our condition.” The hope was that improved technologies would bring greater harmony and peace to the human condition."

I know that peace and joy are not found in the latest piece of technology, but in the Lord. Teaching is hard work, especially striving to teach with excellence. I taught the topic of energy recently and I was reminded again of some encouraging words that Paul wrote in a letter to the Colossians, "...teaching everyone with all wisdom, that we may present everyone mature in Christ. For this I toil, struggling with all His energy that He powerfully works within me." Yes, that is where I want to get my energy. I pray that even though frustration may accompany the learning of anything new, that this article may bring some peace and encouragement to some.

So what is my philosophy/theology of technology? It is part of the dominion mandate in Genesis 1:28. I recently read Foundational Concepts of Christian Education that is on the Geneva College website. It discusses the implication of this for the school, student, curriculum, and discipline. But what is the implication for educational technology? The pros and cons of adopting an innovation ought to be weighed as part of considering the cost. Recognizing the sinfulness of humans, safeguards should be set up to protect and limit wrong use. The key thing to recognize is that technology is not the answer or goal, but is a tool to be rightly used.

The right tool for the right job. My grandfather used to say, "A place for everything and everything in its place."
If you need a tool for a certain job, it is a lot easier to find it if it is where it belongs. We did try to do some organizing of the garage this summer, which is probably why it wasn't too difficult to find these tools pictured on the left. The old pipe wrench actually belonged to my Grandpa Bird. It is large, adjustable to various sizes and provides the mechanical advantage you need to turn a pipe that is really stuck. Now, I don't really know that from personal experience, because I've never needed to loosen or tighten a pipe. But I love it and think it is really cool.

I actually have a slide rule somewhere too. But I've never used that to solve logarithms or get a decimal approximation of a trigonometric value.
Similarly, since I started working at Covenant Christian High School in Indianapolis, I can't remember using a chalk board until the last week when I was helping out an older public school as a math coach. They had recently acquired some great technology and wanted to be encouraged to better utilize it.

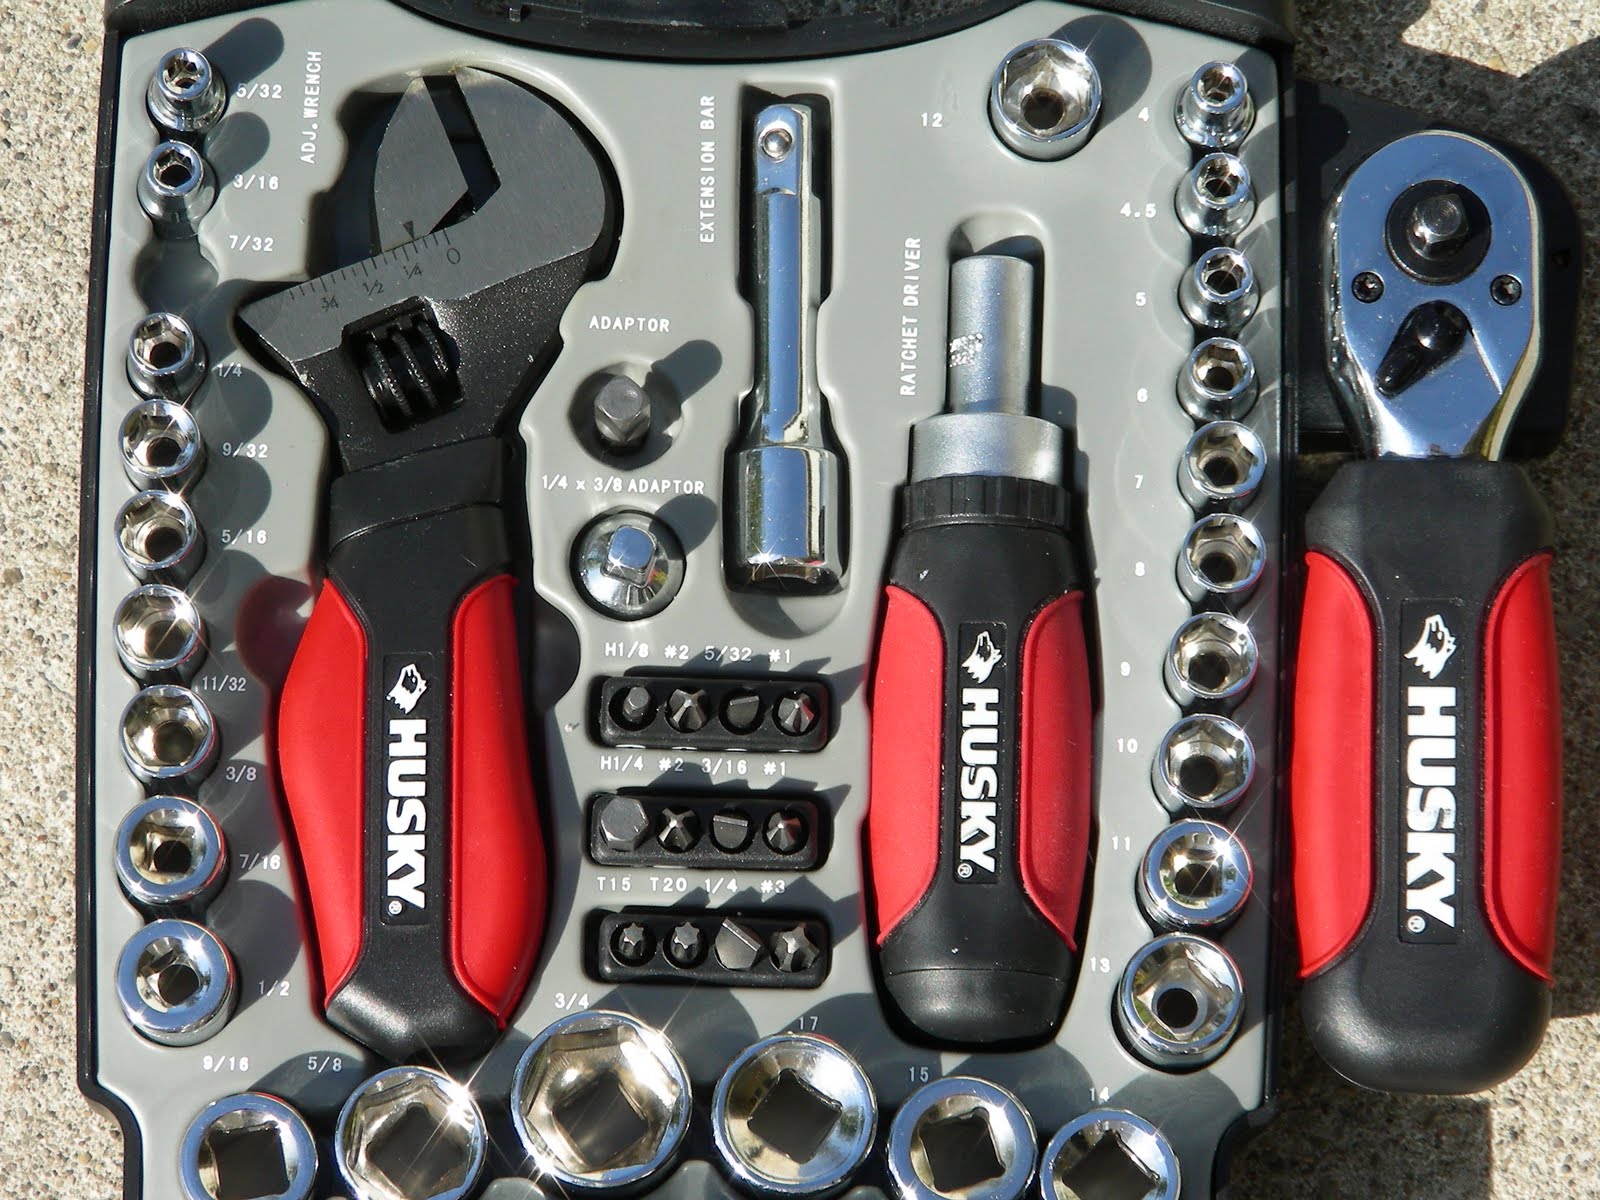
Within the past couple of years, my dad got me this handy little socket set. I have had occasion to use some of the ratchets.
It has some nice features. For example, the tool in the middle can act like a typical screw driver when the appropriate tip is put on the end, but it has a ratchet mechanism that can be easily adjusted to tighten or loosen.

Like a four function calculator, this tool cannot do everything. The adjustable monkey wrench on the left wouldn't open to the size of a large pipe. Similarly, you can't easily graph a function on a scientific calculator.

With any interactive white board you should be able to write on in it and save your work, but not all of these tools are designed to particularly enhance the math and science classroom like SMART Notebook Math Tools can. I have enjoyed showing this off at conferences and using this tool in my classroom from the time it was only available as a free download in its beta form. A couple of weeks ago I had a wonderful time showcasing SMART's Math Tools to an outstanding group of middle and high school teachers at a Christian school in Cincinnati.
One thing I especially appreciate about Notebook Math is that it recognizes its limitations and encourages teachers to be aware of the value of graphing calculators and TI emulators. The SMART Notebook on the computers I've used these past several years can be used to launch my TI-Nspire CAS Teacher Software with its built-in TI-SmartView emulator capabilities.

With some tools there is so much power and functionality that you may never use every piece. Even if I took a class to learn about the drill I have on the left, although I would learn more of what the different bits were for, I may not use them again. I really appreciate when a tool is intuitive and many things about it can be figured out without reading many manuals.

The sentiment that the TI-Nspire is intuitive to use has been the general impression I've seen in many students who have been introduced to it. A video that a friend from Scotland is in shows the engagement of the students, the formative assessment capabilities, and many of the other features that are gained by using the Nspire Navigator. I also appreciate that the operating system of the Nspire and Navigator have been improved over the years based on teacher feedback. These updates have come at no additional cost. This tip sheet says that it can take over 30 minutes to update the OS for every device in the classroom, but I've been able to do it many times in less than 5 minutes. The tip sheet is a bit dated, as there are now more ways to improve classroom connectivity.

Sometimes people do not use the best tool for the job. There are many reasons why this is true. If you want to see a variety of tools used for math and science education, the Teachers Teaching with Technology International Conference will be a good place to learn more. This has been one of my favorite conferences of the year.

Monday, August 30, 2010

More on the TI-Nspire Software

Recently on the AP Calculus electronic discussion group the question came up, "What software do you use for generating graphs. For example, for a limits test. How can I generate a graph with removable discontinuities, jumps, etc. Is there a good software program out there for generating graphs?"
There were several replies of programs that use esoteric nomenclature or fancy tricks.
One person replied "I don't have one that works well with piecewise functions (most will handle continuous pw functions with some cajoling and using logical operators (<, <=, >, >=, and, or etc) with Boolean (ie 1 or 0) output, but typically go bonkers when you have discontinuities)... I was just creating a diagram for f(g(x)) where f and g are PW functions for a precal class, and everything I have has come up woefully short (the TI's won't even evaluate Y1(Y2(x)) if you've used the logical operator kluge to get pw functions).
So I'm also all ears if someone has a graphing program that will handle PW functions in a reasonable way."

The most reasonable way I have found to do piecewise functions is with the TI-Nspire. Here was my response with some additional pictures and explanation included:
The TI-Nspire Software may be what you are looking for.
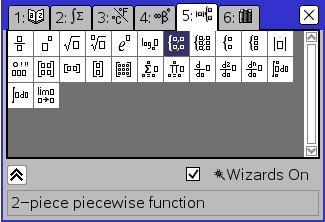
It will do piecewise functions in a very natural way - just like they look in a textbook. There is a math template for piecewise functions. Just press the button (highlighted in red in the first picture on the left) or you can find it in the catalog. The nice thing about the catalog is that it gives a verbal identifier as you can see in the picture on the left.

The Nspire will also do composite functions. You can even change the name of a graph from f1(x) to f(x) and g(x) and let h(x)=f(g(x)). I tested it with a composition of piecewise functions and it worked great too. This was really easy to do. Here is what I did: Open a graph page, arrowed over and deleted the 1 in f1(x) so it would say "f(x)=". Then I press the math template button and filled in the blanks. Next I arrowed down and made it g(x). Finally, I arrowed down one more time and entered h(x)=f(g(x)).

Also with the TI-Nspire CAS you can do many implicit/conics by entering, for example, f1(x)=zeros(x^(2)+y^(2)-25,y)

The graphs look really clean (not large pixels) if you use View > Computer. CTRL J is the shortcut for getting screen shots.

You can download the software that comes free with new purchases of the TI-Nspire Touchpad at http://education.ti.com/educationportal/downloadcenter/SoftwareList.do?website=US&tabId=1&paneId=6002#10
You could also get the TI-Nspire or TI-Nspire CAS Teacher Software for free from a Learn & Earn program http://education.ti.com/html/nspire/learn-earn.html

Yesterday in Physics First and in my AP Calculus class we studied the relationship between position, velocity and acceleration with graphs. We collected data with CBR2 motion detectors. Students plugged these into their handhelds and I could also plug it into my computer and begin collecting data automatically with the TI-Nspire Software.
Notice that the labels on the axes were automatically changed from x and y to Dist(m) and Time(s). These labels can be manually changed of deleted entirely.

On a Data & Statistics page the labels are the variable names.

The students then analyzed the graphs with menu > Trace > Graph Trace. It was fun to have the students predict what the corresponding velocity-time graph would look like and use a dynamic Data & Statistics page to easily who what the calculated solution would be. This is easily done by clicking the left side of the screen. I . I also enjoy just pressing tab to quickly change the variable. The default of the motion detector is to measure the distance every 0.05 seconds. At the same time it populates two other columns of data: dc01.vel1 for velocity and dc01.acc1 is the acceleration for data collection trial 1.

This was a graph of a ball rolling up an incline. At first it increased its distance away from the motion detector and then it came back down. The little imperfection near the peak was when it moves a bit horizontally near the top of the incline. Usually I use a nice racquetball but this time a used a larger less perfectly spherical ball we got from this summer's public library reading program. As you can see the acceleration was a component of -9.8m/s^2. Students who have at least had geometry may be able to even figure out what the angle of the incline was. This ball on an incline experiment is outlined at the end of an Xtreme Calculus activity. There is a link to this TImath.com activity from this site.

From the first time I taught algebra, I've always said that there is now better way for students to develop an understanding of slope than to walk it out and immediately see what kind of graph they are making because of how fast they are moving.

At the end of James Nickels explanation of projectile motion he wrote
"Such is one of the amazing revelations that mathematics gives us about the many nuances of the physics of motion, motion governed by the wisdom of God in Christ (Colossians 1:15-17; 2:1-3). These covenantal laws are treasures that man discovers by investigating the creation order (Proverbs 25:2). Classical physics, founded by men like Galileo, Kepler, and Newton, is a sequence of one fascinating revelation after another. This essay is only one example of these quantitative wonders."