Friday, July 27, 2012

TI-Nspire Vernier DataQuest Collection Setup

Inquiry and Problem-Based Learning are a couple of ideas you hear about in education recently. Teachers want students to be engaged with real-world situations and actual data collection.
The TI-Nspire is a great tool to collect and analyze data . When using the TI-Nspire with a new probe or sensor it will automatically detect it and set up a default configuration, so that the student can just press the green collect data button (or TAB to the green arrow and press ENTER). However, there are times that the students may decide that they want to collect data for a longer period of time or, as is the case with a light sensor and a fluorescent bulb, perhaps they only want to collect data for 0.05 seconds and yet get a couple hundred "Number of points."  So you can either right-click from the left details panel or press MENU, Experiment, Collection Setup...
The following screen appears which has raised questions from first time users of DataQuest: What is a Strip Chart, and can I get more information about Data Markers? 
Inline image 1
The following is my attempt to shed some light on these options. 

Strip chart: Imagine a heart rate monitor at a hospital. Once the time of collecting data is displayed, this strip of graphed data moves to the left. This is nice to use when you want to start the data collection, but you don't want it to stop until you get some 'good' data. For example perhaps you only want one good bounce or so of a ball. You could decrease the time from the default 5 seconds, to 2 seconds and keep the collection going until you see a good bounce.  (Regarding ball bounced, try holding/positioning the CBR2 at a nice height where it is not distracted by nearby objects and ZERO and REVERSE the sensor.)

Inline image 1
Regarding data markers. Here is an example of some data that can be used to explore the linear relationship between the strength of the magnetic field B (in milliteslas) and the current I (in amps) in an electromagnet or solenoid, a coil of wire.  The relationship is B= mu-naught * n*I, where n is the number of coils per length and mu-naught is a fundamental constant of nature. It is always a real delight to 'discover' constants of the universe right in the classroom. E.g. bounce a ball and you can easily experimentally determine acceleration of gravity on the surface of the earth. 

Inline image 2
Notice that each set of data has a marker that displays at regular time intervals. I think part of the reason this appears by default is for the sake of those who are not enjoying the color of the TI-Nspire CX or for colors that may appear similar.

There seems to be a difference between Point Markers (pick which shape you want for which list of data) and Data Markers. ***

Under menu, Options, Point Options...
You can choose to not connect all the data points and you can see that the default is regional, but can be changed to mark none or all.
Inline image 3

You can add Data Markers after the data is collected. I right clicked (ctrl menu) in the details panel on the left to get the option. See the screen shot below.
Inline image 4

This marker shows up in the table, by making that data point bold and it appears when the data is presented in other formats. Notice the extra big blue circle below.


Inline image 5

What you are asking about is wondering about the options in the Collections Setup.
If this box is checked, you will not get any dots.

*** Update [I just received some additional information that I think will be of interest to those who search and find this site.] 
Inline image 6"Point markers are specific to identifying which column is which.  They are a kin to the TI-84 Stat Plot Mark option.  The defaults are Regional for Time-Graph collections and All for events with entry or selected events collections.  In the case you are using the Melt Station*, the Point mark option is set to None (because we also use Data Markers with that sensor). 

A Data Marker is used to annotate a graph with specific points of interest.  The annotation appears as an extra big point mark (on the graph) and a bold entry in the table.  The data mark can include text to identify points.  In math, you might collect a set of data and have students go in and mark and label several points of interest (relative max/min, points of inflection, etc.). In science, you might be identifying other things like when a color change happened in a reaction or when stirring began.   

Data Markers can be added after collection or can be set up to add during collection (which is automatically done for the Melt Station*).  When you chose the option to use Data Markers during a collection (from the data collection setup menu), we set the point marks to none.  This makes it so you will only show the points of interest that you mark.  To mark a point during collection, press the camera icon (Like the Keep button) and the next collected point will be marked (notes can be added after collection is complete).  You can mark as many points as you want. The marked points are shown in the Details menu to the right of the graph. 

*The Melt station needed this functionality.  This lab apparatus is used to find the melting point of organic solids which melt over a range of temperatures.  Data Markers are used to identify when the organic substance first starts to melt and then when it is completely melted.  These are added during collection.  By default, Data Markers is checked in the data collection setup menu for this sensor. 

In "Science with TI-Nspire Technology", we made use of data markers in several of the labs.·        
Lab 7 Dew Point – we mark the point when dew first starts forming on the can.·         
Lab 17 Ventilation and Heart Rate – we mark the point when you start holding your breath or start hyperventilating. ·         
Lab 27 Ball Toss – We mark (after collection) when you started to toss the ball, when the ball left your hand, when the ball is at its maximum height, when the ball is first caught, and when the ball comes to rest in your hand.  What is neat about that is you mark the position graph and since the marks are related to time, you get marks on velocity and acceleration as well

Monday, March 5, 2012

TI-Nspire STEM Project Challenge final report

Wind Turbine Blade Quantity Optimization

Background

  • Guiding Question: What is the optimal quantity of blades on a wind turbine?
  • Designers must balance turbine blade numbers between too much weight for wind to offset the inertia of the blades, and too few blades to maximize the amount of wind power gathered.
  • Many other turbine-like systems use three blades, such as outboard motors, aircraft propellors, squirrel-cage fans, and windmills.
  • The need for alternative energy is growing.
  • Energy can be harvested from the wind using turbines.
  • Optimizing the number of blades maximizes the amount of energy collected.
  • Production costs often delay the monetary returns of efficiency.
  • When more turbines are added to a turbine system, the system gains more inertia.
  • Often, turbines with two blades are used for higher wind speeds.
  • Three blades are more efficient than two, due to lesser rotor loading, and fewer aerodynamic losses. They are also quieter.
  • Parts of a Turbine:
  • Tower: wind speeds are faster at greater altitudes.
  • Blade : much like an airplane propellor, turbines use numbers like 1, 2, 3, 4, & 6.
  • Generator : converts kinetic energy to electrical energy.
  • Controller : shuts turbine down at high speeds.
  • Nacelle : cover of generator/controller
  • Anemometer : measures wind speed
  • “Many modern wind turbines use three blades because they give greater dynamic stability than either two blades or one.” (Gipe 104)

Hypothesis -If three blades are used on a turbine, then the turbine will have an optimal rotational velocity.

Experiment - Materials:

  • TI-Nspire CX CAS
  • TI-Nspire Lab Cradle
  • Vernier Rotary Motion Sensor
  • Vernier Hand-held Anemometer
  • PC with TI-Nspire student software
  • Connector USB Cable for TI calculator
  • LEGO set 9688 (Renewable Resources)
  • Crusader floor fan
  • Honeywell squirrel-cage fan
  • Duracraft squirrel-cage fan
  • Fan speeds (measured with anemometer)
  • Low: 1.0 m/s
  • Medium: 5.2 m/s
  • High: 15.3 m/s
  • Procedure
  • Place Duracraft fan a meter away from the makeshift LEGO/rotary motion sensor turbine; connect the turbine to the TI-Nspire lab cradle.
  • Measure the fan output at the turbine using the anemometer and the TI-Nspire.
  • Collect the data for 10 seconds per trial using the Rotary Motion Sensor for six, three, and two blades on the turbine.
  • Repeat the previous two steps with the Honeywell fan, and again with the Crusader fan. All fans should be set to their respective “high” settings.
Variables: Independent - wind speed, blade number, Dependent - rotational velocity of the turbine.

Data & Results

Blade # High (rad/s) Medium (rad/s) Low (rad/s)

3 98.5 86.3 23.8

6 94. 1 67.0 28.0

2 103.2 74.4 27.4

All values are arithmetic averages of the respective data collected.

Error & Uncertainty

  • Used rotary motion sensor backwards, collecting negative data.
  • No wind-speed proportionality to real-life situations.
  • “Spikes” in the data, from sensor errors offset the mean value of the data.

Conclusion

Refutation of Hypothesis

If three blades are used on a turbine, the turbine will have a maximum energy output under medium wind speeds. However, under higher or lower wind speeds, fewer or more blades optimize the amount of energy gathered, respectively.

A Better Experiment

  • Reverse fan blades to switch negative data to positive.
  • Use a LEGO energy sensor to measure the energy output of the turbine.
  • Perform larger more realistic scale tests.
  • Use more realistic wind speeds.

What We Learned

  • Physics behind turbines
  • Using the Vernier DataQuest and TI-Nspire student software more efficiently.
  • Data collection and organization skills.

Sources:

  • Alternative-energy-resources.net/definewindenergy.html
  • Nasa.gov/vision/earth/technologies/wind_turbines.html
  • Environment.arc.nasa.gov
  • Aesp.nasa.okstate.edu/ftp/anderson/PublicCareersModule.pdf
  • Paul Gipe, Wind Power, page 103, 3, & 4

J-Term Wind Turbine Experience

During a two week internship opportunity in January, I interned at company called Performance Services. They focus on guaranteed energy savings. In order to accomplish these savings, they generally redesign the heating ventilation and air conditioning systems of k-12, healthcare, and higher education buildings. However, another aspect they look at is the viable sources of alternative energy that can complement the energy savings of their current project. During my experience with them, I was able to actually visit a site where they were installing wind turbine for a high school. I learned many interesting things such as: the higher up a turbine is placed the faster the winds will be that it will experience, many people find wind turbines unsightly and the blades of the turbine can cast a very irritating flickering shadow there are differing regulations, depending on state laws, that determine how close a turbine may be to any building or how tall it may be; when a building is not using all of the output of a privately owned turbine, the extra power generated can often be sold back to an electrical company; most turbines are made outside the United States.

From this I learned that a Turbine near Covenant Christian High School is not possible with the current property that Covenant owns. (Covenant would have to purchase property at a more isolated location). However if this were not a problem, then Covenant could very likely own and make a profit and save money with a wind turbine.

Joe Igleski,

Covenant Christian, Junior

Saturday, March 3, 2012

Graphing Conics and x=

At the Teachers Teaching with Technology International Conference we got a glimpse of what will be coming in the next OS release of the TI-Nspire. This OS 3.2 will provide some unique features that will continue to set the TI-Nspire apart as the tool of choice for mathematical exploration.

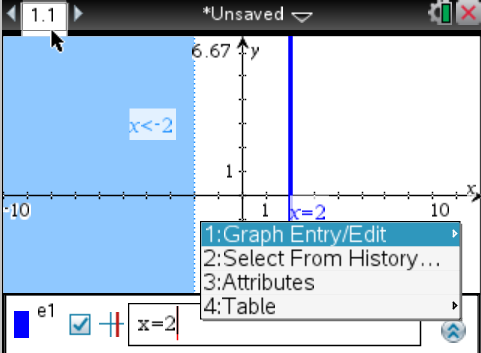
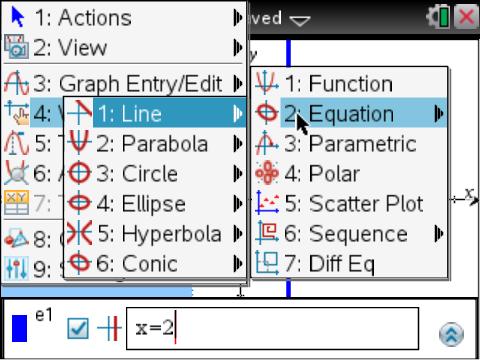
I am especially exciting about what some may consider to be a little thing: Having the first option under right-click (ctrl menu) from the entry line be to change the type of graph that can be entered in the entry line. (Note: Even from the Menu it is no longer referred to as “Graph Type.” It is now called “Graph Entry/Edit”) This short cut is a much appreciated efficiency.


image of right-click (ctrl menu) from entry line image of menu, Graph Entry/Edit, Equation

Other features that provide reasons to get excited include:
- Graphing vertical lines from the entry line!
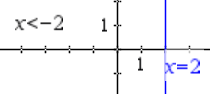
- Graphing inequalities like x<-2. To do this type text on the screen. Then drag it to an axis.
- Similarly, graphing inverse equations, like x=sin(y)
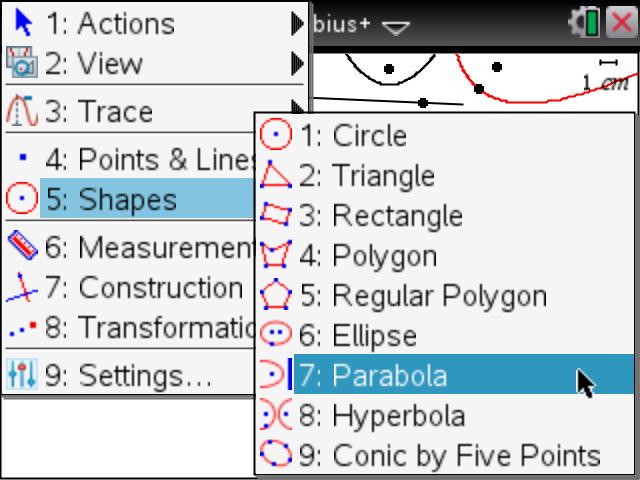
- Conics on a Geometry page.

Others are impressed with these features. See their video on YouTube.

Monday, February 20, 2012

Renewable Energy Handbook

The Renewable Energy Handbook is a guide to help people live away from the energy grid and be able to survive on renewable energy. From wind power to solar power, this book offers more than one way to generate energy that is earth friendly and cost-effective. This book offers do-it-yourself instructions so that you can build your own energy source and conserve the environment at the same time. Although the instructions are a bit advanced, these projects will help save money off of your energy bill. And, you gain a sense of self-accomplishment after completing a project you built.

Happy conserving,

Adam Linscott, Sophomore

Covenant Christian High School

Monday, February 6, 2012

Wind Belts

Wind belts, still a new concept and technology, are basically elastic bands that vibrate when an air current passes over them. The reason wind belt technology is so great is that it is 10 to 30 times as efficient as the best micro turbines, small scale wind turbines.

Wind belt technology can completely revolutionize the energy crisis in developing countries as well as in America. It is so great because it can be so easily harnessed for home use.

In fac,t it is more effective small scale. (For more information, read about wind belts on Popular Mechanics website. The above is a summary of research done by Joe Igleski.)This is called the aero-elastic flutter effect. Have you tried to blow on a piece of grass while holding it in your hands in order to get it to buzz of whistle? The vibration of the strand of grass that causes the sound you hear is caused by the aero-elastic flutter effect. Shawn Frayne used this effect to successfully

generate electricity on scale never even imaginable with wind turbines. The reason wind turbines are not successful small scale are because of all of the friction the turbine experiences in the gear box and other components. A wind belt simply has two permanent magnets on either end of the oscillating elastic band so that the two magnets are passing by wire coils producing a current. The lack of rotary motion results in much smaller amounts friction.

Saturday, January 21, 2012

Blabbering Pine Marten

I just got back from iMATHination math/science/technology conference where I shared the exciting features of the TI-Nspire CX CAS and the TI-Nspire Navigator. It was quite an adventure getting to the conference at the Q Center in St. Charles, West of Chicago. While driving up there, 6-9 inches of snow came down. The last hour of the drive turned into 4 hours. I grateful to have made it there safely and in time to give my Friday nigh Math Bash presentation called "Hands-on Learning of Slope: Math and Science Connections with the TI-Nspire CX CAS, Navigator and the Vernier DataQuest Application."

From one of the sessions I attended I learned about a website called Blabberize.com. My second oldest daughter used it to do her science project. When making the mouth, the large green dot indicates how low the mouth will drop. It was hilarious fun to make. Enjoy the production.


Update: If we would have watched this video tutorial, it would have been even easier to make our first 'Blabber.' Exploring is nice, but trial and error can be time consuming. I also discovered an example of how this Web2.0 tool can be using in the mathematics classroom.
I wonder if this blabberizing animals can be considered an application of Genesis 1:28 - having dominion of living things that move on the earth.

Tuesday, January 17, 2012

TI-Nspire CX CAS Blabberized

The J-term class has a little TI-Nspire CX CAS mascot that can say a few words about itself. Enjoy the blabberized Nspire.

Monday, January 16, 2012

LEGO NASA TI Project Explore! J-term

This year's J-term class added LEGO Mindstorms into the mix of STEM activities. This fit in perfectly with the NASA and TI-Nspire CX connections. Besides making NASA Spinoff videos as part of the Optimus Prime competition (my favorite NASA Spinoff video was done by my own children), they also were faced with several challenges, including

Beginning Challenges

q 1. Make a robot that moves at a constant positive velocity. Graph this. Find the velocity.

q 2. Design and program a robot to move with a constant negative velocity. Collect data of this motion and graph the data. Calculate the velocity.

q 3. Collect data for 10 trials of the LEGO robot moving at a constant speed. Is it the same speed for each trial? Does it lose power? What is the velocity for the first trial and for the last trial? Power is the rate at which energy is used or the rate work is done. Kinetic energy, the energy of motion, is ½ m v2 . Calculate the kinetic energy and the power for the 1st and last trial.

q 4. Design and program a LEGO robot to move with a constant velocity, then with a zero velocity, and finally a negative velocity. Collect the data. Graphically show that this challenge was accomplished. Find the velocity for each segment.

q Bonus. Program a LEGO robot to do a random TI-Nspire Vernier DataQuest Motion Match.

q Acceleration: Program a robot move with a smooth positive and negative acceleration. Graph it and calculate it. (See the video made by one of the teams.)

q Friday competition. Using only the constraint of time, do the calculation and use the software to program your LEGO robot travel a surprise distance.

Next Challenges -

q Construct a wind turbine that will turn freely when a fan blows on it. Use a photogate to calculate the angular speed.

q Elevator. Collect data similar to the beginning challenges, but for an elevator. See this YouTube video for what this looked like in action or this one with the LEGO NASA astronaut.


I was excited that, despite the mild winter, it snowed enough for the students to go outside and do an investigation in the snow. The blue line shows the data that was collected as they walked outside and begin collecting data. The red curve shows what happened when this student put the Temperature probe into a pile of snow. Enjoy the video of their data collection.


Wind turbine ... LEGO TI Inquiry

What makes a good shape for the blades of a wind turbine? How many blades are best? It was interesting to see some students first attempt with using LEGO to make a wind turbine. You can see example of 2, 3 and 4 blades. Early attempts failed because there was no tapering to the blade. A straight blade did not turn when a fan was turned on it.
Symmetry was also important. If it wasn't balanced, the turbine had difficulty experiencing enough torque to cause it to continue rotating. After having groups of students design their own wind turbines and testing them using the Vernier
Rotary sensor with the TI-Nspire we used the blades from our new LEGO 9688. The TI-Nspire Lab Cradle is needed in order to collect data with the Rotary Motion Sensor. (For more about he Lab Cradle see this entry.)
Student were asked to predict the number of blades to optimize the rotational speed. Here are the results of the Quick Poll from one class.


As you can see in the graph below, 6 blades were the slowest, then 2, and finally the magnitude of the 3 blades rotational speed was the greatest. The data from this experiment was gathered with a wind speed of around 5 m/s.

Update 3/5/2012: This number of blades hypothesis and experiment was done with several of my classes and at the T^3 International Conference. The results from the QuickPolls are interesting to see how the prediction between 2,3, and 6 blades are often evenly split. The data from the experiments is beautiful. For most wind speeds we've done, but not all, the results show that 3 blades result in the greatest angular velocity. The discussion about why this is also enjoyable: More blades will catch more wind, but they will have more mass.

Monday, December 26, 2011

Power from the Wind

The following is a brief summary of the book Power from the Wind:

Power from the Wind explains the importance of wind and the power that can be harnessed from it. Dan Chiras, the author of the informative book, helps those intrigued by the idea of wind energy by giving them a checklist of things to consider before setting up a windmill. The book covers all areas of study needed for a solid knowledge of wind energy. After reading this book, anyone can know what wind is and how it can be used to improve the world around us.

http://www.amazon.com/Power-Wind-Achieving-Energy-Independence/dp/086571620X

Thursday, December 15, 2011

Wind Power

The following is a brief summary by Kristen of the book Wind Power by Paul Gipe.

This book is one of the main resources Covenant has been using for information about wind power.
It goes into detail in the costs, the technology and plans for the future with wind technology. But in order to improve the future of this technology, we must understand the current technology. One of the current problems of wind energy is cost-effectiveness; the revenue made from windmills is not much more than creating one of the machines. Another difficulty being faced with wind power is the safety and size of the machines themselves. These machines are very large and many fatal accidents have occurred, but in the past 30 years there have been numerous improvements. We intend to improve other aspects of harvesting this power just as they have been improving the safety of it so that we may be able to have a resource that does little to no harm to the planet. The information from this book has allowed us to refine what our goals are and allow us to apply ourselves to the task of improving current designs.

Thursday, December 8, 2011

Geographic Information System - Renewable Energy

The following summary was written by Rebecca, a senior at Covenant Christian High School, on the subject of GIS and Renewable Enerery.
The GIS (Geographic Information System) is a technological tool for understanding geography and making smart decisions with the information learned. We, as occupants of this planet, need to understand the importance of geographical locations and how they pertain to nature and the world around us. Mainly, this knowledge of our surroundings helps us to make informed decisions about the planet we live on. The GIS helps us pinpoint geographical locations on maps in a much quicker way than doing it by hand or having to do it in a more complicated way. One of the main things about the GIS is that it is interactive. Like the article says: “...it helps explore the complexity of our world.” GIS is not only improving the way we produce and deliver energy, it is changing the way we view our earth's resources. Most people do not realize how much energy is used in simple things every day, such as microwaves, electricity appliances, and cars. The GIS improvement and the success of the GIS product makes energy saving better for both the people and the environment. We are always looking to save money, cut back on things, and provide for our families. Although those are important things to think about, how rarely do people think about conserving energy and making sure things are renewable? How often do we as humans realize that not everything in this world and environment just shows up because it’s there? I think that a lot of people, myself included, should take more of an interest to the environment and God’s Creation around us.

Thursday, December 1, 2011

Wind Power in Indiana

The following summary of Wind Power in Indiana website was written by senior Mikaela.
Until 2008, wind power in Indiana was limited. Indiana's first utility-scale wind power facility is Goodland (phase I), with a nameplate capacity of 130 MW (2008). Since then, three more wind farms opened up in 2009: Fowler Ridge (phase I & II) Meadow (phase I), and Hoosier. Indiana ranked 10th amoung U.S. states as of September 30th, 2010, having a total of 1238 MW of wind capacity. Most of Indiana's wind power development has been in the northwest area. In February 2010, the National Renewable Energy Laboratory showed that Indiana had potential to install up to 148 GW of onshore wind power nameplate capacity, generating 443 TWh annually, in comparision to consuming 106.549 TWh of electricity in 2005. According to the USDOE (United States Department of Energy), each 1000 MW of wind power capacity installed in Indiana will annually save 1,684 million gallons of water and eliminate 3.1 million tons of carbon dioxide emissions; Indiana emitted a total of 230,830,000 metric tons of carbon dioxide in 2007.

Tuesday, November 15, 2011

Wind for Schools

The following is a brief summary by Alex from the website Wind for Schools
With the knowledge that the future of our energy lies within the children of today, the U.S. Department of Energy’s Wind Powering America Program developed the Wind for Schools program in 2006. The main objectives of this program include: to encourage university-level wind education and training, to promote on-site education at the K-12 level by installing wind systems at schools unable to fund them on their own, and to support K-12 wind energy education in schools with installed systems and surrounding schools. This program is currently operating in eleven states, and is open for starting in other states. The most used and recommended product for schools wishing to participate is the Skystream wind turbine. When schools install this, they also get a full communication system which allows students to monitor the performance of their turbine and energy consumption. This is a great tool for the learning community.

Saturday, November 5, 2011

Small Wind Electric Systems

The following is a brief summary by Nick of Indiana's Consumer Guide for wind systems:

Wind electric systems are not only for the big businesses and important companies; they are also for the average homeowner. If a home is sitting on land that has enough empty cleared space and wind speed, then installing a wind electric system could possible to the best option for their energy needs. If it is unknown whether or not there is enough wind speed, U.S. Wind Resource Maps is a valuable tool. The cost of installing the system depends on the height of the tower and the diameter of the rotor blade. Also, a general rule of thumb is that the wind tower will cost anywhere from 1,000 to 5,000 dollars per kilowatt on initial installation. It is recommended that a wind electric system be installed by a company that specializes in it. This is not something that should be attempted without an expertise in electricity and manufacturing. For a home wind electric system, it is suggested to use a guyed system. There are three different types of guyed systems: balance, stand-alone, and grid-connected. All three have their own benefits and it is something that a home owner should look into before deciding to install a system.

Friday, November 4, 2011

Pressure Sensor - Work

The students are doing a lab to better understand the relationship of pressure and volume, also known as Boyle's Law. They will also find work by using the Vernier DataQuest application on the TI-Nspire.

The following video shows the set up and the experiment. A screen shot showing the analysis done to find work follows.


To find the work, the area under the P-V diagram, use menu Analyze, Integral. It is important that the work is negative. Why is it negative?

Wednesday, November 2, 2011

Egg Launch and wind near a building

During the end of October, Covenant Christian High School held their annual Egg Launch, an event where students build capsules to protect eggs launched from the roof of a building. The overall goal is for distance. In addition, Physics students are faced with the challenge of limiting their egg capsule to fifteen centimeters in diameter while AP Physics students are required to construct their capsule in less than five minutes. Through this event, we learned more about trajectory, gravity, and the effects of air resistance, in addition to figuring out what materials are the most shock absorbent. Much of the challenge is figuring out how to build a capsule as small and light as possible.

On the day of the egg launch, there was minimal wind, with maximum gusts of not much more than 1 m/s. Due to the size of the egg capsules, the wind likely had a negligible effect on the distance of the egg launch. But as a well struck baseball will only travel half as far as it would have it were to travel in a vacuum, air resistance does have an appreciable effect. Overall, out of 100 eggs, 21 survived with the maximum distance being over 60 meters. Obviously their grade wasn't based on the survival of the eggs. You can read more about the rules, parameters and grading of the Egg Launch at this site.

The AP Physics still participate in this event as an enjoyable review of collisions, conservation of energy and projectile motion. They do not need to write the paper again, but they do need to do the calculations. Their rules are there are no rules except to construct the protective container in the first five minutes of class.

So while I was on the roof, I took the opportunity to measure the wind speed, as previously mentioned. I put the TI-Nspire CX CAS and the TI-Nspire Lab Cradle with the anemometer on a larger metal contraption on the roof, over 5.6 meters above the ground. As I was cleaning up, I forgot to look there for the TI-Nspire. The next day I get to school and am looking all over the place for the it. I finally figure out that the only place it could be is on the roof. I would not recommend putting your Nspire to a test like this. I'm certain it is not waterproof, but it withstood a large amount of dew as seen in the pictures below. We were praising God that the devices were created with some quality durability.

Friday, October 21, 2011

STEM Project ... wind

Today was another windy day in Indiana.
God is in control of the wind. In Mark 4 (and parallel passages in Matthew 8 and Luke 8) the disciples were in a boat with Jesus when a great windstorm arose. They thought they were going to drown. Jesus got up, rebuked the wind and said to the waves, “Quiet! Be still!” Then the wind died down and it was completely calm. He said to his disciples, “Why are you so afraid? Do you still have no faith?” They were terrified and asked each other, “Who is this? Even the wind and the waves obey him!”

Jesus also spoke of our limited knowledge of the wind when he was talking to Nicodemus (in John 3). He said, "You should not be surprised at my saying, ‘You must be born again.’ The wind blows wherever it pleases. You hear its sound, but you cannot tell where it comes from or where it is going. So it is with everyone born of the Spirit.”

For the TI-Nspire STEM Project Challenge, students are to select a topic of interest that they want to investigate and explore, based on an issue or problem in the community (local, state or national) that they wish to change.

An interesting topic to investigate and explore is getting energy from WIND.
Indiana Wind
Within the past several years, Indiana has become the home of many wind farms. Is wind power an answer to our nation's problem of dependence on foreign oil? The rising cost of energy makes us wonder what can be done to reduce our reliance on 'disposable' energy. Is wind energy a viable solution for home and business energy in our area? Let's study wind turbines, rotational motion, wind power and energy.

In the next weeks and months, my students will share laboratory experiments they have done with the TI-Nspire Lab Cradle and Vernier sensors and summarize their findings from the following links.

- Small Wind Electric System: An Indiana Consumer's Guide http://www.windpoweringamerica.gov/pdfs/small_wind/small_wind_in.pdf
- Purdue University's Windy Energy website
- Geographic Information System for Renewable Energy http://www.esri.com/library/bestpractices/renewable-energy.pdf
- Instructions to construct and Windbelt generator
- Kid Wind Project - Humdinger Windbelt kit
- Wind for Schools & Skystream
- Popular Mechanics - Windbelt
- Wind Power in Indiana

Recently an update about the potential for wind energy was published. This shows that Indiana could generate 443 TWh annually. For comparison, Indiana consumed less than 107 TWh of electricity in 2005. However, in 2010, the state only produced 1.24 TWh of electricity (which is better than many of our neighbors, but not in the top 5. Two of our wind farms did make the top 10 list.)
Wind Resources

Thursday, October 13, 2011

STEM Project Challenge ... ideas

This summer our school was accepted to participate in the TI-Nspire STEM Project Challenge. I am so excited about how well this fits in with what we are doing and my goals for my students, and not just the AP Physics & Calculus students, but also the Physics First freshmen.

Like with the NASA Student Launch Initiative we participated in years ago where Covenant Christian High School received a several thousand dollar contract with NASA, we wanted to come up with an idea that was truly worthwhile. See point#3 on this Covenant NASA-SLI website.

We began brain storming ideas. Some of these are recorded on this website. (There are also some fun pictures of how we are using the TI-Nspire in class, which sometimes means outside.)
I wonder which of the ideas listed, sound most interesting to you?

An idea the students got excited about that didn't make the list was to make a jet pack. In researching that, they came upon an impressive (and hilarious) water jet pack.