 Recently on the AP Calculus electronic discussion group the question came up, "What software do you use for generating graphs. For example, for a limits test. How can I generate a graph with removable discontinuities, jumps, etc. Is there a good software program out there for generating graphs?"
There were several replies of programs that use esoteric nomenclature or fancy tricks.
One person replied "I don't have one that works well with piecewise functions (most will handle continuous pw functions with some cajoling and using logical operators (<, <=, >, >=, and, or etc) with Boolean (ie 1 or 0) output, but typically go bonkers when you have discontinuities)... I was just creating a diagram for f(g(x)) where f and g are PW functions for a precal class, and everything I have has come up woefully short (the TI's won't even evaluate Y1(Y2(x)) if you've used the logical operator kluge to get pw functions).
 So I'm also all ears if someone has a graphing program that will handle PW functions in a reasonable way."
The most reasonable way I have found to do piecewise functions is with the TI-Nspire. Here was my response with some additional pictures and explanation included:
The TI-Nspire Software may be what you are looking for.
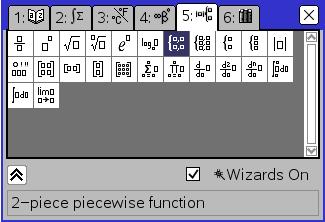
It will do piecewise functions in a very natural way - just like they look in a textbook. There is a math template for piecewise functions. Just press the button (highlighted in red in the first picture on the left) or you can find it in the catalog. The nice thing about the catalog is that it gives a verbal identifier as you can see in the picture on the left.
 The Nspire will also do composite functions. You can even change the name of a graph from f1(x) to f(x) and g(x) and let h(x)=f(g(x)). I tested it with a composition of piecewise functions and it worked great too. This was really easy to do. Here is what I did: Open a graph page, arrowed over and deleted the 1 in f1(x) so it would say "f(x)=". Then I press the math template button and filled in the blanks. Next I arrowed down and made it g(x). Finally, I arrowed down one more time and entered h(x)=f(g(x)).
Also with the TI-Nspire CAS you can do many implicit/conics by entering, for example, f1(x)=zeros(x^(2)+y^(2)-25,y)
The graphs look really clean (not large pixels) if you use View > Computer. CTRL J is the shortcut for getting screen shots.
You can download the software that comes free with new purchases of the TI-Nspire Touchpad at http://education.ti.com/educationportal/downloadcenter/SoftwareList.do?website=US&tabId=1&paneId=6002#10
You could also get the TI-Nspire or TI-Nspire CAS Teacher Software for free from a Learn & Earn program http://education.ti.com/html/nspire/learn-earn.html
Yesterday in Physics First and in my AP Calculus class we studied the relationship between position, velocity and acceleration with graphs.
 We collected data with CBR2 motion detectors. Students plugged these into their handhelds and I could also plug it into my computer and begin collecting data automatically with the TI-Nspire Software.
Notice that the labels on the axes were automatically changed from x and y to Dist(m) and Time(s). These labels can be manually changed of deleted entirely.
On a Data & Statistics page the labels are the variable names.

 The students then analyzed the graphs with menu > Trace > Graph Trace. It was fun to have the students predict what the corresponding velocity-time graph would look like and use a dynamic Data & Statistics page to easily who what the calculated solution would be. This is easily done by clicking the left side of the screen. I . I also enjoy just pressing tab to quickly change the variable. The default of the motion detector is to measure the distance every 0.05 seconds. At the same time it populates two other columns of data: dc01.vel1 for velocity and dc01.acc1 is the acceleration for data collection trial 1.

 This was a graph of a ball rolling up an incline. At first it increased its distance away from the motion detector and then it came back down. The little imperfection near the peak was when it moves a bit horizontally near the top of the incline. Usually I use a nice racquetball but this time a used a larger less perfectly spherical ball we got from this summer's public library reading program. As you can see the acceleration was a component of -9.8m/s^2. Students who have at least had geometry may be able to even figure out what the angle of the incline was. This ball on an incline experiment is outlined at the end of an Xtreme Calculus activity. There is a link to this TImath.com activity from this site.
From the first time I taught algebra, I've always said that there is now better way for students to develop an understanding of slope than to walk it out and immediately see what kind of graph they are making because of how fast they are moving.
At the end of James Nickels explanation of projectile motion he wrote
"Such is one of the amazing revelations that mathematics gives us about the many nuances of the physics of motion, motion governed by the wisdom of God in Christ (Colossians 1:15-17; 2:1-3). These covenantal laws are treasures that man discovers by investigating the creation order (Proverbs 25:2). Classical physics, founded by men like Galileo, Kepler, and Newton, is a sequence of one fascinating revelation after another. This essay is only one example of these quantitative wonders."

2 comments:
Mr. Bird,
I find this notation to be very confusing...
f1(x)=zeros(x^(2)+y^(2)-25,y)
Isn't f1(x) the value of y????
Do you see what I mean?
- Bill
Regarding graphing the conics with the TI-Nspire CAS, the zeros() command may make more sense to you if you try it on a Calculator application.
You can graph a list of functions in one graph. For example, graph f1(x)=x+a|a={1,2,3}
or
f2(x)={1,2,3}x
Does that help?
Post a Comment