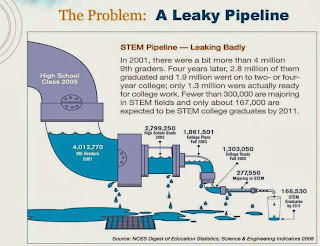
I went to STEM Workforce meeting in Indianapolis in April 2012 where a good number of decision makers spoke. The visuals from the presentations for these meetings that have been held throughout the country are posted at http://www.ndia.org/Divisions/Divisions/STEM/Pages/Events.aspx
This picture of the STEM pipeline can be found in one of the presentations.
Check out the video at www.ndia.org/Divisions/Divisions/ST...fault.aspx (This gives the business and national defense viewpoint of the need for students to do hard things and study STEM.)
NMSI was at the Indianapolis meeting. It was great meeting some of their leaders and learning about their expansion into Indiana.
This is also where I first heard about SeaPerch, which our school participated in last year. Other great STEM initiatives my students and I have participated in this year are TARC, Team America Rocketry Challenge, and VEX Robotics.
Another interesting bit of STEM news: The President of Texas Instruments Education Technology division, Melendy Lovett, was recognized as one of
the top 100 STEM women leaders.
Wednesday, January 15, 2014
Tuesday, January 14, 2014
TI-84 with CBR - how to turn off Auto Scale
I was recently asked, "How do you turn off 'Auto Scale' on a TI-84?" So I made a video to explain this. It also helps answer the question "how do you connect a CBR to your computer so that it will display on the TI-84 SmartView emulator?"
YouTube video link
 The scale can be changed after the data is collected, but the following demonstrates how to make it so that this is not necessary. Good news: Once this has been done, the setting will not need to be changed again for that TI-84. Press “Setup” and choose “2: Time Graph…”

 Choose “Adv” for the advanced settings. Then “Edit” to change the “Auto Scale After Collect” to “No.”
You may have noticed when you plug in a CBR2 using the mini-USB it
automatically launches EasyData app. You can then just press ‘soft key’
for “Start” and a graph of the data shows up in real-time. However, if
you are not moving, the auto scale makes it look like a jagged graph.
This may be confusing to students. “If I wasn’t moving, why does my
graph look like I was.” They may not realize that the y scale is only
over a few millimeters, and this shows the amount of precision that the
motion detector is able to account for as it determines the distance
sound reflects off of a surface. “Attend to precision” is an important
mathematical practice.
Not all of the modes do this auto-scaling. Distance Match does not auto scale.
Friday, January 10, 2014
Magnetic Field Experiments
I have had students use the Vernier magnetic field sensor and the rotary motion sensor to examine the Earth's magnetic field at their location. When magnetic field versus angle is graphed, the data is sinusoidal. Variations of this lab available in lab books can be previewed on Vernier's website.
You can see images of the Slinky lab, or magnetic field in a solenoid, at this blog post. We updated the instructions that you can preview on Vernier's website. They are written for the TI-Nspire's Vernier DataQuest on our class website: View Download.
Subscribe to:
Posts (Atom)

