At a recent webinar called "Technical Problem Solving with Vernier® Sensors and TI-Nspire™ Technology" the stated purpose was: "Whether you are looking for STEM resources, teaching a secondary engineering course, or participating in Science Olympiad’s Technical Problem Solving event, this webinar is right for you! See examples of rich technical and engineering problems, and learn how TI-Nspire technology can help students investigate a given problem, analyze and interpret data, and design a solution. Explore how to gather data using the built-in Vernier® DataQuest™ application and the Vernier® EasyTemp™ USB temperature sensor, the Calculator-Based Ranger 2™ (CBR 2) motion sensor and the Vernier Colorimeter. Learn where to locate helpful resources for using additional Vernier sensors with TI-Nspire technology." Linda showed a website for the Winter Olympics 2014 and 2010, Summer Olympics, Golf, Hockey, etc…
- Stability and Vibration in Alpine Skiing - click on the Lessons tab on the right.
Do with Vernier damped harmonic motion activity with CBR2 motion detector
Math connections - sinusoidal, exponential
Data was modeled (menu, Analyze, Model) with a function that was the product of an exponential and sinusoidal.
Question: Can a model be done before data is collected.
Answer: Yes, in fact there are 2 (or 3 ways) to predict the graph before collecting data.
1) Menu, Analyze, Model.
2) Menu, Analyze, Draw Prediction. This is less of a mathematical approach, but can still be mathematically useful - e.g. increasing, decreasing, positive slope, negative slope, etc.
3) With a CBR attached you can enjoy Menu, Analyze, Motion Match. For more tips with motion match see this pdf and word doc.
Colorimeter (affordable, device worth $1000s, but only $115) demonstrated with TI-Nspire Navigator, Live Presenter shows a students handheld
- concentration is proportional to absorption
- Collecting data with Vernier and TI-Nspire is a time saver.
- Linearizing data (very important in sciences, especially AP)
- Linearize exponential data by taking the natural log of it. 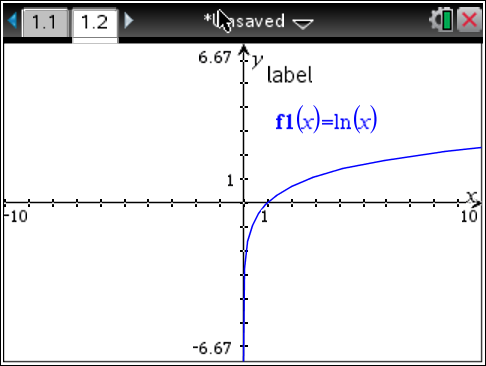
- This was demonstrated in a List & Spreadsheet.
It could also be done in DataQuest: Menu > Data > New Calculated Column…
Note that the domain of y=ln(x) is x>0. So if any data is negative, they’ll need to be struck before taking the natural log of it. Menu > Data > Strike Data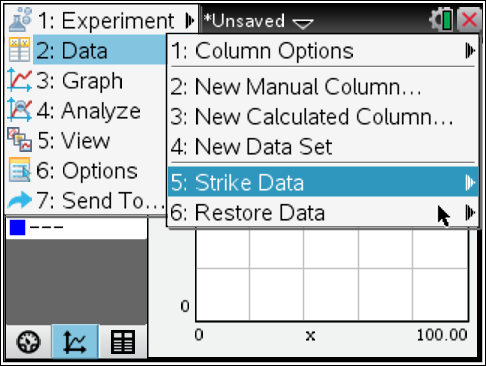
Extra Tips: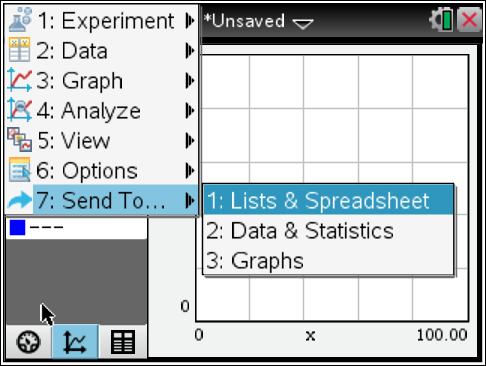
- If you want to use your data in other Apps, or environments,
with OS3.6, you can now export the data to other apps by pressing MENU > 7: Send to...
- The menu> Analyze > Tangent on DataQuest is powerful.
*Technical Problem Solving with Vernier® Sensors and TI-Nspire™ Technology
Level: All
Whether you are looking for STEM resources, teaching a secondary engineering course, or participating in Science Olympiad’s Technical Problem Solving event, this webinar is right for you! See examples of rich technical and engineering problems, and learn how TI-Nspire technology can help students investigate a given problem, analyze and interpret data, and design a solution. Explore how to gather data using the built-in Vernier® DataQuest™ application and the Vernier® EasyTemp™ USB temperature sensor, the Calculator-Based Ranger 2™ (CBR 2) motion sensor and the Vernier Colorimeter. Learn where to locate helpful resources for using additional Vernier sensors with TI-Nspire technology with panelists Linda Antinone and Mike Smith
The zip file for the documents does not contain any of the tns files with data. It contains a pdf of the PowerPoint slides that was used at the beginning and end of the presentation. Also included is the TI-Nspire Data Collection and Analysis Guidebook (available online with other guidebooks.) 
No comments:
Post a Comment