The J-term class has a little TI-Nspire CX CAS mascot that can say a few words about itself. Enjoy the blabberized Nspire.
Tuesday, January 17, 2012
Monday, January 16, 2012
LEGO NASA TI Project Explore! J-term
This year's J-term class added LEGO Mindstorms into the mix of STEM activities. This fit in perfectly with the NASA and TI-Nspire CX connections. Besides making NASA Spinoff videos as part of the Optimus Prime competition (my favorite NASA Spinoff video was done by my own children), they also were faced with several challenges, including


Beginning Challenges –
q 1. Make a robot that moves at a constant positive velocity. Graph this. Find the velocity.
q 2. Design and program a robot to move with a constant negative velocity. Collect data of this motion and graph the data. Calculate the velocity.
q 3. Collect data for 10 trials of the LEGO robot moving at a constant speed. Is it the same speed for each trial? Does it lose power? What is the velocity for the first trial and for the last trial? Power is the rate at which energy is used or the rate work is done. Kinetic energy, the energy of motion, is ½ m v2 . Calculate the kinetic energy and the power for the 1st and last trial.
q 4. Design and program a LEGO robot to move with a constant velocity, then with a zero velocity, and finally a negative velocity. Collect the data. Graphically show that this challenge was accomplished. Find the velocity for each segment.
q Bonus. Program a LEGO robot to do a random TI-Nspire Vernier DataQuest Motion Match.
q Acceleration: Program a robot move with a smooth positive and negative acceleration. Graph it and calculate it. (See the video made by one of the teams.)
q Friday competition. Using only the constraint of time, do the calculation and use the software to program your LEGO robot travel a surprise distance.
Next Challenges -
q Construct a wind turbine that will turn freely when a fan blows on it. Use a photogate to calculate the angular speed.
q Elevator. Collect data similar to the beginning challenges, but for an elevator. See this YouTube video for what this looked like in action or this one with the LEGO NASA astronaut.


I was excited that, despite the mild winter, it snowed enough for the students to go outside and do an investigation in the snow. The blue line shows the data that was collected as they walked outside and begin collecting data. The red curve shows what happened when this student put the Temperature probe into a pile of snow. Enjoy the video of their data collection.


Wind turbine ... LEGO TI Inquiry
 What makes a good shape for the blades of a wind turbine? How many blades are best? It was interesting to see some students first attempt with using LEGO to make a wind turbine. You can see example of 2, 3 and 4 blades. Early attempts failed because there was no tapering to the blade. A straight blade did not turn when a fan was turned on it.
 Symmetry was also important. If it wasn't balanced, the turbine had difficulty experiencing enough torque to cause it to continue rotating. After having groups of students design their own wind turbines and testing them using the Vernier

Rotary sensor with the TI-Nspire we used the blades from our new LEGO 9688. The TI-Nspire Lab Cradle is needed in order to collect data with the Rotary Motion Sensor. (For more about he Lab Cradle see this entry.)
Student were asked to predict the number of blades to optimize the rotational speed. Here are the results of the Quick Poll from one class.
As you can see in the graph below, 6 blades were the slowest, then 2, and finally the magnitude of the 3 blades rotational speed was the greatest. The data from this experiment was gathered with a wind speed of around 5 m/s.


Update 3/5/2012: This number of blades hypothesis and experiment was done with several of my classes and at the T^3 International Conference. The results from the QuickPolls are interesting to see how the prediction between 2,3, and 6 blades are often evenly split. The data from the experiments is beautiful. For most wind speeds we've done, but not all, the results show that 3 blades result in the greatest angular velocity. The discussion about why this is also enjoyable: More blades will catch more wind, but they will have more mass.
Monday, December 26, 2011
Power from the Wind
The following is a brief summary of the book Power from the Wind:
Power from the Wind explains the importance of wind and the power that can be harnessed from it. Dan Chiras, the author of the informative book, helps those intrigued by the idea of wind energy by giving them a checklist of things to consider before setting up a windmill. The book covers all areas of study needed for a solid knowledge of wind energy. After reading this book, anyone can know what wind is and how it can be used to improve the world around us.
http://www.amazon.com/Power-Wind-Achieving-Energy-Independence/dp/086571620X
Thursday, December 15, 2011
Wind Power
The following is a brief summary by Kristen of the book Wind Power by Paul Gipe.
This book is one of the main resources Covenant has been using for information about wind power. It goes into detail in the costs, the technology and plans for the future with wind technology. But in order to improve the future of this technology, we must understand the current technology. One of the current problems of wind energy is cost-effectiveness; the revenue made from windmills is not much more than creating one of the machines. Another difficulty being faced with wind power is the safety and size of the machines themselves. These machines are very large and many fatal accidents have occurred, but in the past 30 years there have been numerous improvements. We intend to improve other aspects of harvesting this power just as they have been improving the safety of it so that we may be able to have a resource that does little to no harm to the planet. The information from this book has allowed us to refine what our goals are and allow us to apply ourselves to the task of improving current designs.
This book is one of the main resources Covenant has been using for information about wind power. It goes into detail in the costs, the technology and plans for the future with wind technology. But in order to improve the future of this technology, we must understand the current technology. One of the current problems of wind energy is cost-effectiveness; the revenue made from windmills is not much more than creating one of the machines. Another difficulty being faced with wind power is the safety and size of the machines themselves. These machines are very large and many fatal accidents have occurred, but in the past 30 years there have been numerous improvements. We intend to improve other aspects of harvesting this power just as they have been improving the safety of it so that we may be able to have a resource that does little to no harm to the planet. The information from this book has allowed us to refine what our goals are and allow us to apply ourselves to the task of improving current designs.
Thursday, December 8, 2011
Geographic Information System - Renewable Energy
The following summary was written by Rebecca, a senior at Covenant Christian High School, on the subject of GIS and Renewable Enerery.
The GIS (Geographic Information System) is a technological tool for understanding geography and making smart decisions with the information learned. We, as occupants of this planet, need to understand the importance of geographical locations and how they pertain to nature and the world around us. Mainly, this knowledge of our surroundings helps us to make informed decisions about the planet we live on. The GIS helps us pinpoint geographical locations on maps in a much quicker way than doing it by hand or having to do it in a more complicated way. One of the main things about the GIS is that it is interactive. Like the article says: “...it helps explore the complexity of our world.” GIS is not only improving the way we produce and deliver energy, it is changing the way we view our earth's resources. Most people do not realize how much energy is used in simple things every day, such as microwaves, electricity appliances, and cars. The GIS improvement and the success of the GIS product makes energy saving better for both the people and the environment. We are always looking to save money, cut back on things, and provide for our families. Although those are important things to think about, how rarely do people think about conserving energy and making sure things are renewable? How often do we as humans realize that not everything in this world and environment just shows up because it’s there? I think that a lot of people, myself included, should take more of an interest to the environment and God’s Creation around us.
Thursday, December 1, 2011
Wind Power in Indiana
The following summary of Wind Power in Indiana website was written by senior Mikaela.
Until 2008, wind power in Indiana was limited. Indiana's first utility-scale wind power facility is Goodland (phase I), with a nameplate capacity of 130 MW (2008). Since then, three more wind farms opened up in 2009: Fowler Ridge (phase I & II) Meadow (phase I), and Hoosier. Indiana ranked 10th amoung U.S. states as of September 30th, 2010, having a total of 1238 MW of wind capacity. Most of Indiana's wind power development has been in the northwest area. In February 2010, the National Renewable Energy Laboratory showed that Indiana had potential to install up to 148 GW of onshore wind power nameplate capacity, generating 443 TWh annually, in comparision to consuming 106.549 TWh of electricity in 2005. According to the USDOE (United States Department of Energy), each 1000 MW of wind power capacity installed in Indiana will annually save 1,684 million gallons of water and eliminate 3.1 million tons of carbon dioxide emissions; Indiana emitted a total of 230,830,000 metric tons of carbon dioxide in 2007.
Tuesday, November 15, 2011
Wind for Schools
The following is a brief summary by Alex from the website Wind for Schools
With the knowledge that the future of our energy lies within the children of today, the U.S. Department of Energy’s Wind Powering America Program developed the Wind for Schools program in 2006. The main objectives of this program include: to encourage university-level wind education and training, to promote on-site education at the K-12 level by installing wind systems at schools unable to fund them on their own, and to support K-12 wind energy education in schools with installed systems and surrounding schools. This program is currently operating in eleven states, and is open for starting in other states. The most used and recommended product for schools wishing to participate is the Skystream wind turbine. When schools install this, they also get a full communication system which allows students to monitor the performance of their turbine and energy consumption. This is a great tool for the learning community.
With the knowledge that the future of our energy lies within the children of today, the U.S. Department of Energy’s Wind Powering America Program developed the Wind for Schools program in 2006. The main objectives of this program include: to encourage university-level wind education and training, to promote on-site education at the K-12 level by installing wind systems at schools unable to fund them on their own, and to support K-12 wind energy education in schools with installed systems and surrounding schools. This program is currently operating in eleven states, and is open for starting in other states. The most used and recommended product for schools wishing to participate is the Skystream wind turbine. When schools install this, they also get a full communication system which allows students to monitor the performance of their turbine and energy consumption. This is a great tool for the learning community.
Saturday, November 5, 2011
Small Wind Electric Systems
The following is a brief summary by Nick of Indiana's Consumer Guide for wind systems:
Wind electric systems are not only for the big businesses and important companies; they are also for the average homeowner. If a home is sitting on land that has enough empty cleared space and wind speed, then installing a wind electric system could possible to the best option for their energy needs. If it is unknown whether or not there is enough wind speed, U.S. Wind Resource Maps is a valuable tool. The cost of installing the system depends on the height of the tower and the diameter of the rotor blade. Also, a general rule of thumb is that the wind tower will cost anywhere from 1,000 to 5,000 dollars per kilowatt on initial installation. It is recommended that a wind electric system be installed by a company that specializes in it. This is not something that should be attempted without an expertise in electricity and manufacturing. For a home wind electric system, it is suggested to use a guyed system. There are three different types of guyed systems: balance, stand-alone, and grid-connected. All three have their own benefits and it is something that a home owner should look into before deciding to install a system.
Friday, November 4, 2011
Pressure Sensor - Work
The students are doing a lab to better understand the relationship of pressure and volume, also known as Boyle's Law. They will also find work by using the Vernier DataQuest application on the TI-Nspire.
The following video shows the set up and the experiment. A screen shot showing the analysis done to find work follows.
To find the work, the area under the P-V diagram, use menu Analyze, Integral. It is important that the work is negative. Why is it negative?
The following video shows the set up and the experiment. A screen shot showing the analysis done to find work follows.
To find the work, the area under the P-V diagram, use menu Analyze, Integral. It is important that the work is negative. Why is it negative?

Wednesday, November 2, 2011
Egg Launch and wind near a building
 During the end of October, Covenant Christian High School held their annual Egg Launch, an event where students build capsules to protect eggs launched from the roof of a building. The overall goal is for distance. In addition, Physics students are faced with the challenge of limiting their egg capsule to fifteen centimeters in diameter while AP Physics students are required to construct their capsule in less than five minutes. Through this event, we learned more about trajectory, gravity, and the effects of air resistance, in addition to figuring out what materials are the most shock absorbent. Much of the challenge is figuring out how to build a capsule as small and light as possible.
On the day of the egg launch, there was minimal wind, with maximum gusts of not much more than 1 m/s. Due to the size of the egg capsules, the wind likely had a negligible effect on the distance of the egg launch. But as a well struck baseball will only travel half as far as it would have it were to travel in a vacuum, air resistance does have an appreciable effect. Overall, out of 100 eggs, 21 survived with the maximum distance being over 60 meters. Obviously their grade wasn't based on the survival of the eggs. You can read more about the rules, parameters and grading of the Egg Launch at this site.
 The AP Physics still participate in this event as an enjoyable review of collisions, conservation of energy and projectile motion. They do not need to write the paper again, but they do need to do the calculations. Their rules are there are no rules except to construct the protective container in the first five minutes of class.
So while I was on the roof, I took the opportunity to measure the wind speed, as previously mentioned. I put the TI-Nspire CX CAS and the TI-Nspire Lab Cradle with the anemometer on a larger metal contraption on the roof, over 5.6 meters above the ground. As I was cleaning up, I forgot to look there for the TI-Nspire. The next day I get to school and am looking all over the place for the it. I finally figure out that the only place it could be is on the roof. I would not recommend putting your Nspire to a test like this. I'm certain it is not waterproof, but it withstood a large amount of dew as seen in the pictures below. We were praising God that the devices were created with some quality durability.


Friday, October 21, 2011
STEM Project ... wind
Today was another windy day in Indiana.
God is in control of the wind. In Mark 4 (and parallel passages in Matthew 8 and Luke 8) the disciples were in a boat with Jesus when a great windstorm arose. They thought they were going to drown. Jesus got up, rebuked the wind and said to the waves, “Quiet! Be still!” Then the wind died down and it was completely calm. He said to his disciples, “Why are you so afraid? Do you still have no faith?” They were terrified and asked each other, “Who is this? Even the wind and the waves obey him!”
Jesus also spoke of our limited knowledge of the wind when he was talking to Nicodemus (in John 3). He said, "You should not be surprised at my saying, ‘You must be born again.’ The wind blows wherever it pleases. You hear its sound, but you cannot tell where it comes from or where it is going. So it is with everyone born of the Spirit.”
For the TI-Nspire STEM Project Challenge, students are to select a topic of interest that they want to investigate and explore, based on an issue or problem in the community (local, state or national) that they wish to change.
An interesting topic to investigate and explore is getting energy from WIND. Within the past several years, Indiana has become the home of many wind farms. Is wind power an answer to our nation's problem of dependence on foreign oil? The rising cost of energy makes us wonder what can be done to reduce our reliance on 'disposable' energy. Is wind energy a viable solution for home and business energy in our area? Let's study wind turbines, rotational motion, wind power and energy.
In the next weeks and months, my students will share laboratory experiments they have done with the TI-Nspire Lab Cradle and Vernier sensors and summarize their findings from the following links.
- Small Wind Electric System: An Indiana Consumer's Guide http://www.windpoweringamerica.gov/pdfs/small_wind/small_wind_in.pdf
- Purdue University's Windy Energy website
- Geographic Information System for Renewable Energy http://www.esri.com/library/bestpractices/renewable-energy.pdf
- Instructions to construct and Windbelt generator
- Kid Wind Project - Humdinger Windbelt kit
- Wind for Schools & Skystream
- Popular Mechanics - Windbelt
- Wind Power in Indiana
Recently an update about the potential for wind energy was published. This shows that Indiana could generate 443 TWh annually. For comparison, Indiana consumed less than 107 TWh of electricity in 2005. However, in 2010, the state only produced 1.24 TWh of electricity (which is better than many of our neighbors, but not in the top 5. Two of our wind farms did make the top 10 list.)

God is in control of the wind. In Mark 4 (and parallel passages in Matthew 8 and Luke 8) the disciples were in a boat with Jesus when a great windstorm arose. They thought they were going to drown. Jesus got up, rebuked the wind and said to the waves, “Quiet! Be still!” Then the wind died down and it was completely calm. He said to his disciples, “Why are you so afraid? Do you still have no faith?” They were terrified and asked each other, “Who is this? Even the wind and the waves obey him!”
Jesus also spoke of our limited knowledge of the wind when he was talking to Nicodemus (in John 3). He said, "You should not be surprised at my saying, ‘You must be born again.’ The wind blows wherever it pleases. You hear its sound, but you cannot tell where it comes from or where it is going. So it is with everyone born of the Spirit.”
For the TI-Nspire STEM Project Challenge, students are to select a topic of interest that they want to investigate and explore, based on an issue or problem in the community (local, state or national) that they wish to change.
An interesting topic to investigate and explore is getting energy from WIND.
In the next weeks and months, my students will share laboratory experiments they have done with the TI-Nspire Lab Cradle and Vernier sensors and summarize their findings from the following links.
- Small Wind Electric System: An Indiana Consumer's Guide http://www.windpoweringamerica.gov/pdfs/small_wind/small_wind_in.pdf
- Purdue University's Windy Energy website
- Geographic Information System for Renewable Energy http://www.esri.com/library/bestpractices/renewable-energy.pdf
- Instructions to construct and Windbelt generator
- Kid Wind Project - Humdinger Windbelt kit
- Wind for Schools & Skystream
- Popular Mechanics - Windbelt
- Wind Power in Indiana
Recently an update about the potential for wind energy was published. This shows that Indiana could generate 443 TWh annually. For comparison, Indiana consumed less than 107 TWh of electricity in 2005. However, in 2010, the state only produced 1.24 TWh of electricity (which is better than many of our neighbors, but not in the top 5. Two of our wind farms did make the top 10 list.)
Thursday, October 13, 2011
STEM Project Challenge ... ideas
This summer our school was accepted to participate in the TI-Nspire STEM Project Challenge. I am so excited about how well this fits in with what we are doing and my goals for my students, and not just the AP Physics & Calculus students, but also the Physics First freshmen.
Like with the NASA Student Launch Initiative we participated in years ago where Covenant Christian High School received a several thousand dollar contract with NASA, we wanted to come up with an idea that was truly worthwhile. See point#3 on this Covenant NASA-SLI website.
We began brain storming ideas. Some of these are recorded on this website. (There are also some fun pictures of how we are using the TI-Nspire in class, which sometimes means outside.)
I wonder which of the ideas listed, sound most interesting to you?
An idea the students got excited about that didn't make the list was to make a jet pack. In researching that, they came upon an impressive (and hilarious) water jet pack.
Thursday, May 19, 2011
Why I Nspire? Part 5 - The List
Features that I find worthwhile about the TI-Nspire CAS include:
- CAS stands for Computer Algebra System. This is great for exploration & discovery of mathematical concepts. It can serve as a ladder to help student reach new mathematical heights.
- Resolution – it has more pixels than any other TI graphing calculator.
- The grayscale was nice (color on the software), but now the TI-Nspire CX CAS includes color! This really is extremely helpful for engagement and enhances understanding. With color graphs I've seen freshmen exploring some advanced transformation, and seniors creating amazing 3-D shapes and animations.
- Images can be inserted.
- Geometry is integrated. No more going to the computer lab for those geometry classrooms. Now dynamic geometry can be in the hands of of every student! This also means lots of great simulations can be and have been made.
- Animation and sliders!
- Notes - makes it so much more of a teaching and learning tool.
- History preserved. Where did a student go wrong? Copy the history.
- Computer short cuts, like CTRL C, V, X, S, Z. (There are more shortcuts listed for "Dummies" here.)
- Content, content, content! There are many inquiry activities that have been written. See TImath.com or MathNspired.com. Also there are textbooks that integrate the use of the TI-Nspire, or as in the case of the Pearson/Prentice Hall textbooks for Algebra 1, Alg 2, and Geometry that now also address the Common Core Standards, the book is on the TI-Nspire.
- Incredibly easy to use data collection. There are so many Vernier probes that automatically work. There is no better way to learn slope or develop an understanding of derivatives and integrals than with real-world applications, like actually walking and seeing data in real-time with a CBR2 motion detector.
- Demonstrations – powerful visuals & multiple representations
- Graph function, polar, parametric, implicit, DE slopefields and more on the SAME screen at the same time!
- Exam acceptance. The TI-Nspire CX CAS is permitted on the AP, PSAT, SAT exam. The TI-Nspire is also allowed on the ACT, IB, and many state end-of-course assessment exams (including Indiana where I'm from). See part 3 blog entry.
- Don't forget all the research (part 1),
- MathPrint (part 4), and the

- software (part 2) that is included.

Saturday, May 14, 2011
Trip To KSC for NASA Student Symposium
 Last Saturday I was heading back home after an amazing trip with two students who participated in the NASA Explorer School's Student Symposium. One of the students suggested I take pictures of the new TI-Nspire CX CAS as it 'visits' various sites on the trip. The image to the left is the Nspire with the Space Shuttle Endeavor just before its last launch. It is scheduled to take off Monday morning. Especially now that the AP Calculus exam is past, teachers may enjoy incorporating shuttle launch data with the technology they have in their classroom (TI-84 or Nspire) by doing a NASA Math & Science @ Work activity. There is also an algebra 1 activity about for the Space Shuttle Ascent.
Part of the inspiration for doing the research that these two freshmen pursued was the NASA Exploring Space through Math Weightless Wonder activity. They used the TI-Nspire and CBR2 motion detector to consider the parabola formed by a ball rolling on a ramp. I posted their PowerPoint presentation on our school's website.
Besides seeing the Endeavor, some highlights from the trip were hearing from the director of the Kennedy Space Center and former astronaut Robert Cabana, talking to astronaut and physicist Samuel Durrance, and hearing from a panel of NASA scientists and employees to encourage the students to pursue the challenging courses. The students got some great advice.
Update: I just got word about a Google Earth plug-in that lets you watch the space shuttle trajectory in real-time. It is similar to the what can be done with the calculus activity that was mentioned above, except this is LIVE. I think this will be particularly interesting when it takes off and lands. Endeavor is scheduled to land at 2:30 a.m. (Eastern time zone) June 1st, and the last shuttle should launch in July.
It requires the desktop version of Google Earth (free download here): http://earth.google.com/
Once you have Google Earth on your machine, just download the .kmz plugin below to your desktop and click it to start. It’s still in beta-mode so those involved in the development of it at the NASA Johnson Space Center in Houston would love to have feedback from teachers and students on what they think. Let me know and I'll pass on the feedback.
http://etouch.cust.footprint.
Wednesday, April 6, 2011
Inserting Images on the TI-Nspire
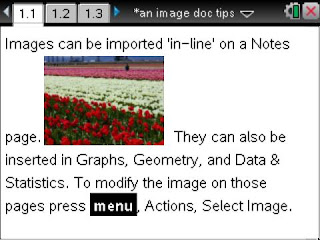
Abstract (That means summary, 'cliffnotes' version for those who are don't like to read the interesting details.): How do you insert an image onto your TI-Nspire handheld? 1st, you need to install your software that comes with the purchase of TI-Nspire. No software? You can get the 30-day trial from TI's website. 2nd, open a document and choose an application like Notes, Graphs, Geometry, or Data & Statistics as shown in the image below. 3rd, click Insert, Image. Pick an image. With your TI-Nspire handheld attached to your computer, you can save the document to your handheld.
[Update: Videos about images on the handheld and what can be done with the TI-Nspire Navigator are now available on youtube. To transfer a file that you inserted an image on from the computer to your handheld, try this video tutorial. The basic insert image tutorial is here.]
Diagrams and pictures can help student engagement and exploration. The TI-Nspire Navigator 3.0 makes it easy to evaluate students in engaging ways. It encourages a new means for students to communicate their explanation of the relationship between their mathematical model and an image. This extends their learning beyond the normal rote problem set into an interactive investigation. Today in class I used the last image in this blog entry, the NASA Space Shuttle launch, to see how well students could write an equation of a line. They said they wish their previous math teacher could have used this. It would have helped them learn and understand slope and y-intercept so much better.
 Images appear crisp and bright in vivid colors on the TI-Nspire CX. It comes with some images already loaded in the TI-Nspire, Images folder. But it is easy to import more jpeg, bmp, png, or clipboard (YES, copy/paste works) images. Any of these work just as well as the other from my experience. For more info about the file types you can read a recent google group conversation. I really enjoy copy/paste. It has been recommended to not use a several megabyte picture, but to keep the file size small. I've used images on a QuickPolls with the Navigator and it took it a second or two for the students to get the question to pop up on their screen rather than the normal nearly instantaneous delivery. But it was worth it.
So how do you insert a picture or image into a TI-Nspire document? It is essentially and easy and clicking 'Insert.'
From the software, images can be put into Questions, Notes, Graphs, Geometry, and Data & Statistics applications by clicking the 'Insert' button and choose 'Image...'.
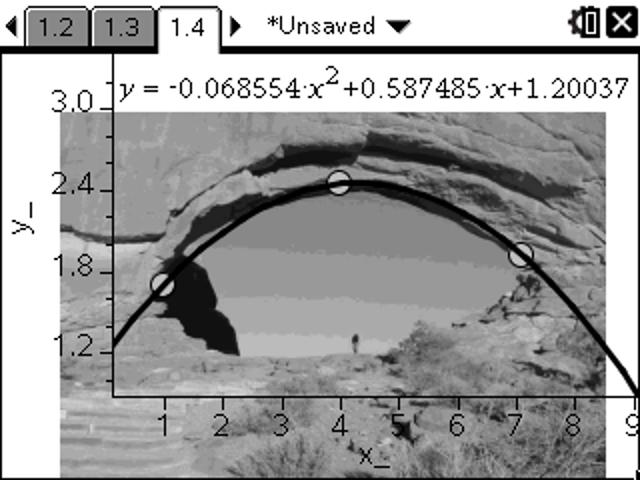
Images convert from color into grayscale well on the Touchpad or Clickpad handheld devices.
The screen shots you see can be found in the 3.0 OS TI-Nspire document here.
All text and lines are mapped to black.
Here is an example from Data & Statistics page. Images can be modified by moving them, change the size but keeping the aspect ratio, squish or stretch vertically or horizontally. Again, on a D&S page select the image by pressing menu, Action, Select Image.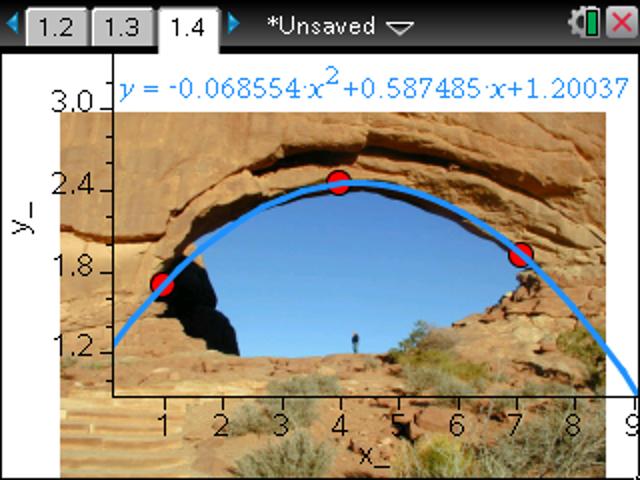
 So there is currently not a way to rotate an image or adjust the transparency. However, there is a way to make an image more transparent on a Graph and Geometry page with the following trick.
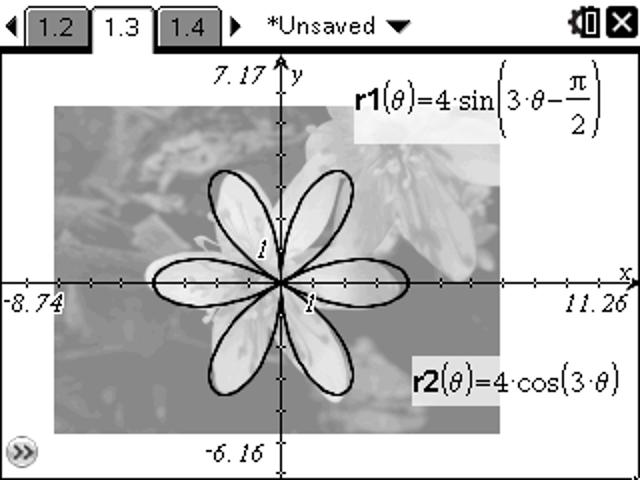
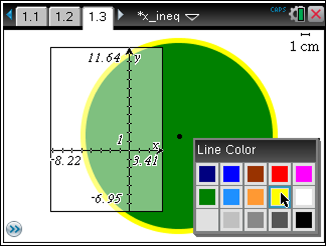
 Note page 1.3 looks like the image is more transparent. Actually what happened is the image was inserted on a Geometry page, THEN the view (press menu>View) was changed to Graphing. This puts a somewhat translucent graph on top of the Geometry View. Similarly you could Show an Analytic Window on top of a Geometry page. This is what it looks like on a TI-Nspire Touchpad.
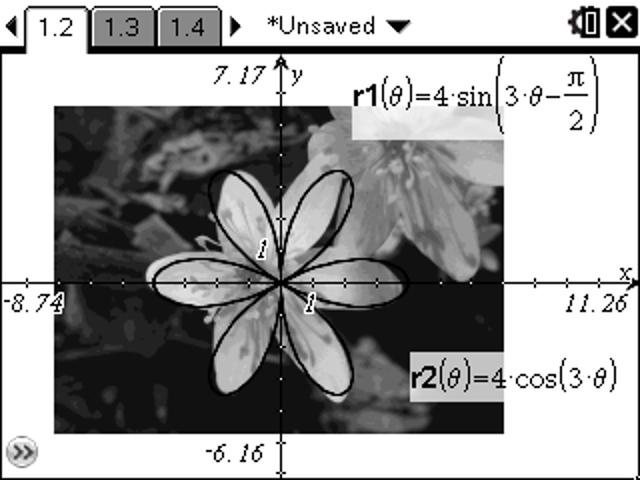
 For this OS we do have color, but we are limited to 9 vibrant choices.
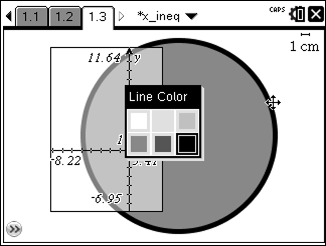
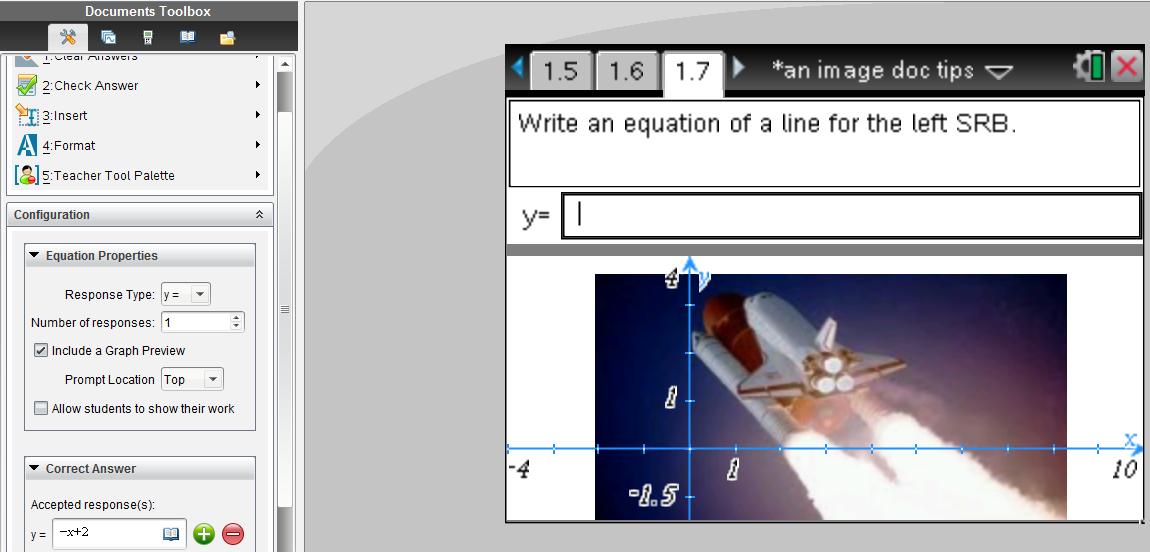
 If you want to have images as part of a question, especially for doing Activity Center-like questions where equations are put on top of images, instead of doing a split screen, use the question type “Equation.” You can choose y= or f(x)= and change it later under ‘Response Type.’ Check the box for ‘Include a Graph Preview’ in order to make a question that will have some extra ease-of-use features. As the example below demonstrates, the student only needs to start typing in the equation and the graph appears and automatically updates. Again, this works when it is a Quick Poll or if it is part of a document.
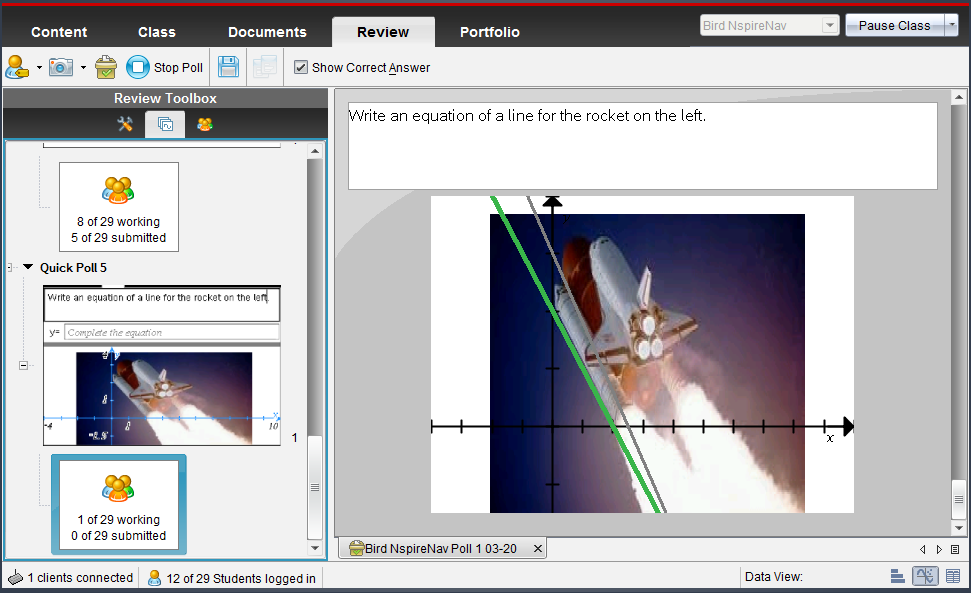 Notice the ‘Data View’ options on the bottom right of the Quick Poll. If Graph is chosen, the image appears and students’ contributions are shown when they press enter.
Gray is the default color for students and green is the correct answer. Under the Review Toolbox is a wrench and hammer. By clicking this Tool and choosing Graph Tools, Individualize Student Responses can be activated.
Another tip in regards to colorful images: Sometimes changing the color of the axes and the line will be beneficial for the students to see their graph. Type something into the y= box and change the attributes and color.
I know the summer workshops will give more hands on experience with images and tips for the use of color. The Connecting Math & Science workshop in Indianapolis (among other places) will also share some updated colorful files to help encourage students toward STEM careers. They will also have colorful 3.0 Nspire files for some NASA activities.
[Update: Videos about images on the handheld and what can be done with the TI-Nspire Navigator are now available on youtube. To transfer a file that you inserted an image on from the computer to your handheld, try this video tutorial. The basic insert image tutorial is here.]
Diagrams and pictures can help student engagement and exploration. The TI-Nspire Navigator 3.0 makes it easy to evaluate students in engaging ways. It encourages a new means for students to communicate their explanation of the relationship between their mathematical model and an image. This extends their learning beyond the normal rote problem set into an interactive investigation. Today in class I used the last image in this blog entry, the NASA Space Shuttle launch, to see how well students could write an equation of a line. They said they wish their previous math teacher could have used this. It would have helped them learn and understand slope and y-intercept so much better.
 Images appear crisp and bright in vivid colors on the TI-Nspire CX. It comes with some images already loaded in the TI-Nspire, Images folder. But it is easy to import more jpeg, bmp, png, or clipboard (YES, copy/paste works) images. Any of these work just as well as the other from my experience. For more info about the file types you can read a recent google group conversation. I really enjoy copy/paste. It has been recommended to not use a several megabyte picture, but to keep the file size small. I've used images on a QuickPolls with the Navigator and it took it a second or two for the students to get the question to pop up on their screen rather than the normal nearly instantaneous delivery. But it was worth it.
So how do you insert a picture or image into a TI-Nspire document? It is essentially and easy and clicking 'Insert.'
From the software, images can be put into Questions, Notes, Graphs, Geometry, and Data & Statistics applications by clicking the 'Insert' button and choose 'Image...'.
Images convert from color into grayscale well on the Touchpad or Clickpad handheld devices.
The screen shots you see can be found in the 3.0 OS TI-Nspire document here.
All text and lines are mapped to black.
Here is an example from Data & Statistics page. Images can be modified by moving them, change the size but keeping the aspect ratio, squish or stretch vertically or horizontally. Again, on a D&S page select the image by pressing menu, Action, Select Image.
So there is currently not a way to rotate an image or adjust the transparency. However, there is a way to make an image more transparent on a Graph and Geometry page with the following trick.Note page 1.3 looks like the image is more transparent. Actually what happened is the image was inserted on a Geometry page, THEN the view (press menu>View) was changed to Graphing. This puts a somewhat translucent graph on top of the Geometry View. Similarly you could Show an Analytic Window on top of a Geometry page. This is what it looks like on a TI-Nspire Touchpad.For this OS we do have color, but we are limited to 9 vibrant choices.If you want to have images as part of a question, especially for doing Activity Center-like questions where equations are put on top of images, instead of doing a split screen, use the question type “Equation.” You can choose y= or f(x)= and change it later under ‘Response Type.’ Check the box for ‘Include a Graph Preview’ in order to make a question that will have some extra ease-of-use features. As the example below demonstrates, the student only needs to start typing in the equation and the graph appears and automatically updates. Again, this works when it is a Quick Poll or if it is part of a document.Notice the ‘Data View’ options on the bottom right of the Quick Poll. If Graph is chosen, the image appears and students’ contributions are shown when they press enter.Gray is the default color for students and green is the correct answer. Under the Review Toolbox is a wrench and hammer. By clicking this Tool and choosing Graph Tools, Individualize Student Responses can be activated.
 * * |  * * |
I know the summer workshops will give more hands on experience with images and tips for the use of color. The Connecting Math & Science workshop in Indianapolis (among other places) will also share some updated colorful files to help encourage students toward STEM careers. They will also have colorful 3.0 Nspire files for some NASA activities.
Monday, April 4, 2011
TI-Nspire Lab Cradle: Part 2
Update: There is a Motion Lab/activity that can serve as a nice introduction to the CBR2 available at this link.
This is an exciting time. I would say that with the use of the TI-Nspire Lab Cradle the number of probes/sensors that can be used nearly doubles. According to a Vernier website the number of available sensors if you are using the Easy Link or Go Link are 50 and with the Lab Cradle it is 58. However, let's say you have some old sensors in the stock room that you thought you would never get to use again. With the right adapter, I have now tested an old accelerometer, pressure sensor, a microphone that was designed for the CBL, and just today I received the Motion Detector Cable MDC-BTD and got the original CBR to collect data as shown in the picture. (Thanks Grant, a top AP calc & physics student, for having your camera and taking the pic.) So the $145 TI-Nspire Lab Cradle can be a really good deal if you have some older equipment. Potentially hundreds of dollars of resources can now be used again and you won't need the approximately $60 Easy Link.
[Update: I've used the Easy Link with the older equipment with great success. Note that there are several data collection sensors like the microphone, photogates, and motion that will not work with the EasyLink's one 'BTA' port, but need the Lab Cradle's 'BTD' ports. The Lab Cradle also has 3 places to plug in 'BTA' plugs so you can, for example, measure temperature of 3 things at the same time like we've done with this evaporation lab.]
Now to the question about 'what data collection equipment should you get?'
If I was consulting your school and helping you develop a plan that fit your teachers, I would begin by asking several questions. But since we aren't having that dialogue, I'll give a general response.
If you don't have any sensors, and you have less than $150, the two data collection probes that all schools ought to have for science and mathematics would be the temperature probe and motion detector - Easy Temp and CBR2.
Neither of these require an additional interface. You can plug them directly into the mini USB on the top of the TI-Nspire. Similarly, if you have have a $5 mini to standard USB adapter, then you can plug a Easy Temp ($38) or CBR2 ($93) into your computer and the Nspire software will auto-detect and begin collecting data.
The gas pressure sensor is another one that (along with Easy Temp) is especially useful in bio, chem & physics.
I was recently asked what sensors I would recommend for an environmental class. Take a look at the recommended probes with the lab book "Investigating Environmental Science through Inquiry." Instruction are provided for pH, conductivity, soil moisture, O2, UV sensor (this appeals to many classes), light sensor (I bet you have that one from your CBL days), etc.
Most of these work with the Easy Link. But you cannot use the microphone with the Easy Link.
That is why I'm so excited about the Lab Cradle: multiple probes, extended battery life and help to power probes with the built in rechargeable battery, AND more sensors that I have been wanting to use.
I think math and physics teachers will be especially excited by the microphone. With a tuning fork you get real-world sinusoidal data that gives audible significance to the general equation y=A*sin(B*x)+C, where B=2pi*frequency or 2pi/T, the period. In mathematics they tend to call the coefficient in front of the x-variable B, but especially when dealing with rotational motion, like a Ferris wheel, I prefer to call it omega, the angular velocity. We used a 512 Hz tuning fork to get the data shown in the screen capture. The curve fit gave a value of 511.7 Hz. I love it!
[Update: Microphone lab with the TI-Nspire and many more are now available from Vernier.]
In addition to the microphone, with the Lab Cradle the 3-axis accelerometer, photogate, nuclear radiation monitor, and rotary motion sensors are new comers to the Nspire family that will be useful for mathematics and science classes.
This is an exciting time. I would say that with the use of the TI-Nspire Lab Cradle the number of probes/sensors that can be used nearly doubles. According to a Vernier website the number of available sensors if you are using the Easy Link or Go Link are 50 and with the Lab Cradle it is 58. However, let's say you have some old sensors in the stock room that you thought you would never get to use again. With the right adapter, I have now tested an old accelerometer, pressure sensor, a microphone that was designed for the CBL, and just today I received the Motion Detector Cable MDC-BTD
 and got the original CBR to collect data as shown in the picture. (Thanks Grant, a top AP calc & physics student, for having your camera and taking the pic.) So the $145 TI-Nspire Lab Cradle can be a really good deal if you have some older equipment. Potentially hundreds of dollars of resources can now be used again and you won't need the approximately $60 Easy Link.
[Update: I've used the Easy Link with the older equipment with great success. Note that there are several data collection sensors like the microphone, photogates, and motion that will not work with the EasyLink's one 'BTA' port, but need the Lab Cradle's 'BTD' ports. The Lab Cradle also has 3 places to plug in 'BTA' plugs so you can, for example, measure temperature of 3 things at the same time like we've done with this evaporation lab.]
Now to the question about 'what data collection equipment should you get?'
If I was consulting your school and helping you develop a plan that fit your teachers, I would begin by asking several questions. But since we aren't having that dialogue, I'll give a general response.
If you don't have any sensors, and you have less than $150, the two data collection probes that all schools ought to have for science and mathematics would be the temperature probe and motion detector - Easy Temp and CBR2.
Neither of these require an additional interface. You can plug them directly into the mini USB on the top of the TI-Nspire. Similarly, if you have have a $5 mini to standard USB adapter, then you can plug a Easy Temp ($38) or CBR2 ($93) into your computer and the Nspire software will auto-detect and begin collecting data.
The gas pressure sensor is another one that (along with Easy Temp) is especially useful in bio, chem & physics.
I was recently asked what sensors I would recommend for an environmental class. Take a look at the recommended probes with the lab book "Investigating Environmental Science through Inquiry." Instruction are provided for pH, conductivity, soil moisture, O2, UV sensor (this appeals to many classes), light sensor (I bet you have that one from your CBL days), etc.
Most of these work with the Easy Link. But you cannot use the microphone with the Easy Link.

That is why I'm so excited about the Lab Cradle: multiple probes, extended battery life and help to power probes with the built in rechargeable battery, AND more sensors that I have been wanting to use.
I think math and physics teachers will be especially excited by the microphone. With a tuning fork you get real-world sinusoidal data that gives audible significance to the general equation y=A*sin(B*x)+C, where B=2pi*frequency or 2pi/T, the period. In mathematics they tend to call the coefficient in front of the x-variable B, but especially when dealing with rotational motion, like a Ferris wheel, I prefer to call it omega, the angular velocity. We used a 512 Hz tuning fork to get the data shown in the screen capture. The curve fit gave a value of 511.7 Hz. I love it!

[Update: Microphone lab with the TI-Nspire and many more are now available from Vernier.]
In addition to the microphone, with the Lab Cradle the 3-axis accelerometer, photogate, nuclear radiation monitor, and rotary motion sensors are new comers to the Nspire family that will be useful for mathematics and science classes.
Tuesday, March 29, 2011
TI-Nspire Lab Cradle: Part 1
 I just got back from a great T^3 STEM Conference in the Atlanta area. It was a blast* sharing "Colorful ConneXions" between math and science with the TI-Nspire CX CAS. (*Yes, I did show a video of the blast off of a recent Space Shuttle launch and gave links to NASA TI-Nspire activities, like this Alg 1 activity.) These CX sessions had an excellent mix of teachers and technology coordinators, including physics, physical science, calculus, and algebra instructors. One participant from Florida, who I hope to see at a Summer Workshop, wanted the session to keep on going because he enjoyed it so much.
Some of the participants were excited to learn about the new Vernier DataQuest application and wanted to know more about the TI-Nspire Lab Cradle, like how much it costs. For the participants who were familiar with Vernier's Logger Pro, they felt right at home with the DataQuest. They were pleased with the options available, like the built-in Motion Match, along with the versatility of the functionality.

Regarding connecting sensors, to use one CBR2 or an Easy Temp you do not need any interface device. Plug it in and you are ready to go and have students make discoveries and connections about slope, sinusoidal cures, parabolas and more. Two of my students won a trip for themselves and me to the Kennedy Space Center for their research and presentation regarding parabolas with the motion detector. (Here is the press release from last year.) Teachers will appreciate that you can just plug in the motion detector and click the green start collection button to get the position-time and corresponding velocity-time graph simultaneously.
Update: With OS 3.6 in December 2013, you don't need to move your cursor or press TAB to get to the green start collection button. It is active and ready for you to press Enter to begin collecting data.
By pressing menu, Analyze, Tangent (derivative) or Integral, calculus classes will find themselves easily making real-world connections.
The Easy Link, an interface between one probe and the TI-Nspire handheld, enables you to plug into a good number of sensors. It costs $59. However, you are still limited to one sensor unless you plug into a computer. You can connect as many sensors as you have USB ports and Go! Links.
Data collection is extremely fast and easy when you do two sensors at the same time. Currently this can be done with the old TI-Nspire Navigator Cradle or with the software.
Now with the TI-Nspire Lab Cradle you can connect the mini-USB port on the top to the USB of your computer (no TI-Nspire handheld required) and enjoy demonstrating data collection with the 3 analog (for most sensors, including voltage, pressure, etc) and 2 digital (like for the CBR, microphone, rotary motion sensor, etc) channels.
Some examples of data collected with two sensors include:

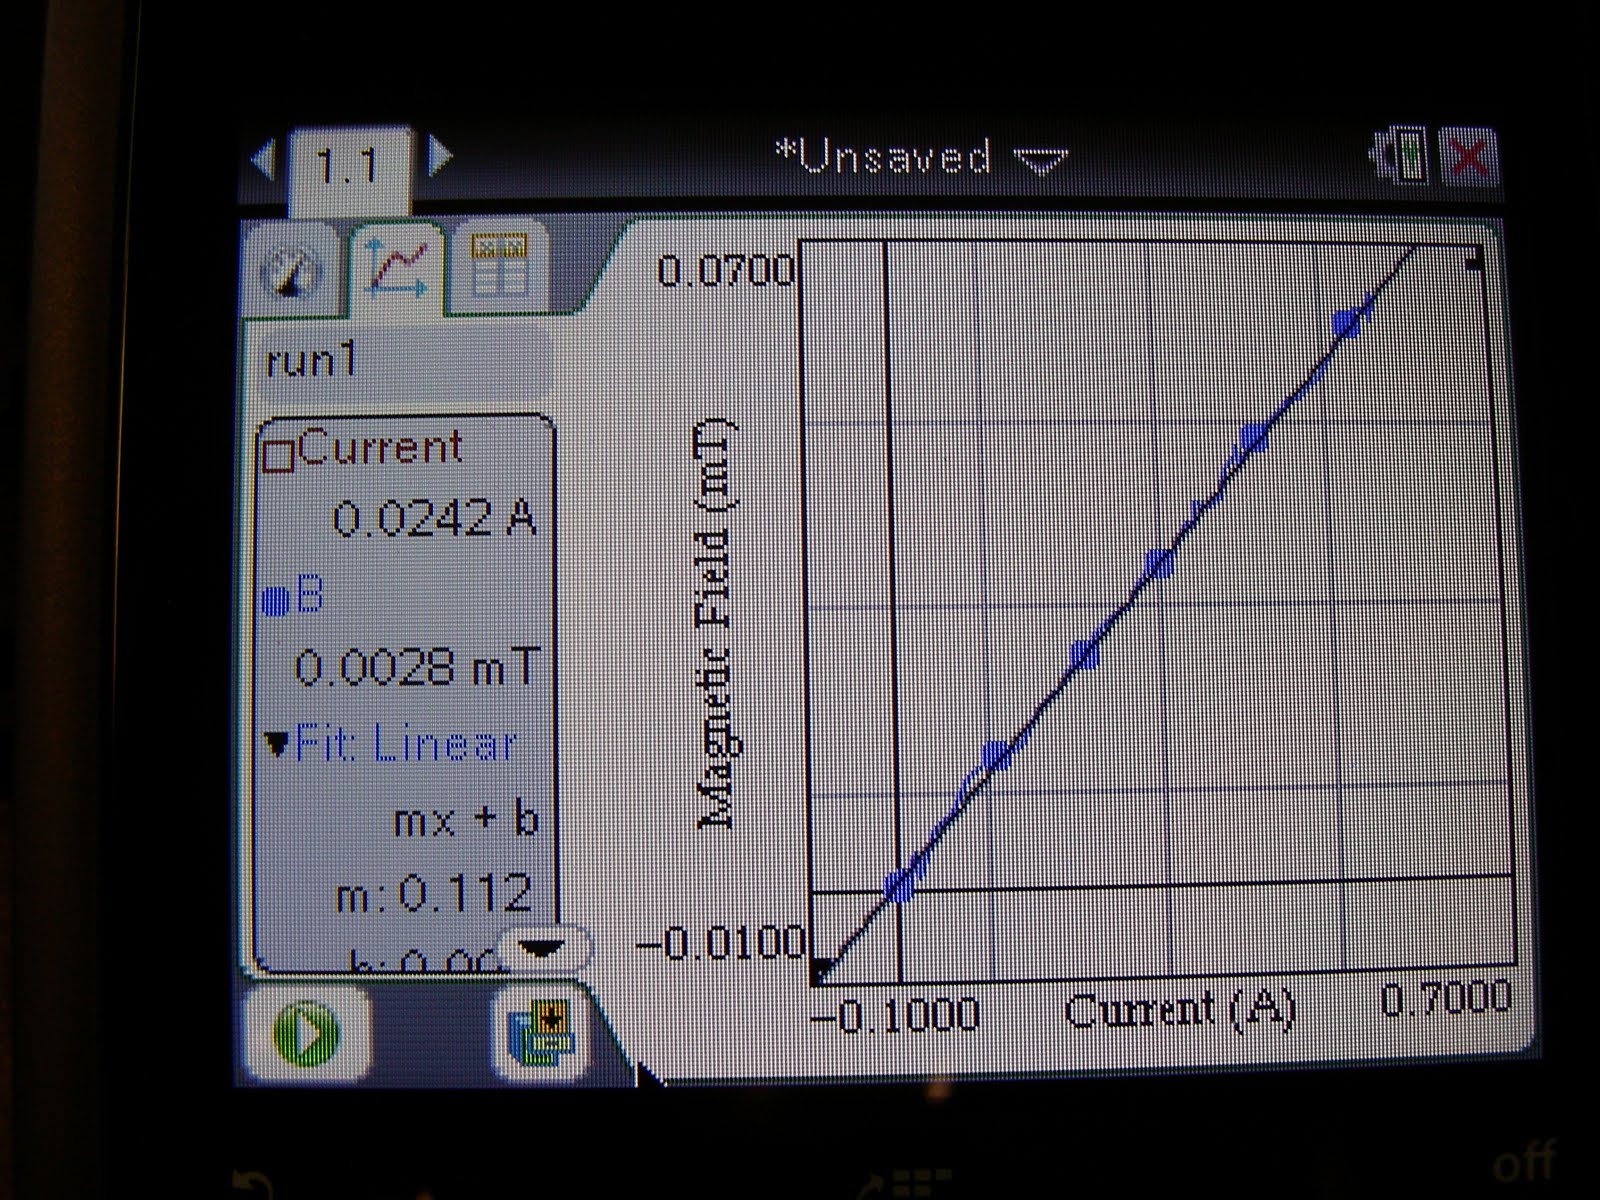
- Magnetic Field Sensor, current probe, and a slinky to get great linear data
- magnetic field sensor and motion sensor for distance for an inverse relationship
- light intensity and distance - an inverse square law relationship
- voltage and current - the slope of this linear data is resistance, based on Ohm's Law.
With the Lab Cradle you will even be able to plug in two CBRs if you have a mdc-btd cable. Students can then investigate motion parametrically. One motion detector can be oriented in the x-direction and the other in the y.
YES, you read that correctly. With the Lab Cradle you can use the old Vernier probes and sensors you've had in a science storage room or mathematics teacher's closet. This includes the CBR! I'll try to share more on this and include pictures this next week.
Also, the TI-Nspire Lab Cradle is like getting 3 Easy Links plus a lot of things you couldn't get or do with the Easy Link. So in that regards the $145 doesn't seem so bad. Especially if you got the 5-pack bundle that comes with a 5-unit charging bay, that would be enough for just about any class size. With the experiment set up, every student could collect the data on their own Nspire.
In a similar price range is Vernier's LabQuest Mini. It is $149. With that you will need a computer with Logger Pro or Logger Pro Lite. Of course with the Lab Cradle you need a TI-Nspire OR a computer with Nspire software (http://www.vernier.com/calc/
Vernier's stand alone device is LabQuest. This impressive colorful touchscreen device is $329, but it comes with the emulator software.
So if your school, or even if it is just you using the TI-Nspire Software, or if you have some students with the TI-Nspire, what should you get?
I'll try to answer this in more detail next time...
Tuesday, March 15, 2011
What does CX stand for?
In the effort to achieve success in the  classroom through the appropriate use of technology the CX brings some exciting improvements. Just yesterday I had a student ask what does the CX stand for in TI-Nspire CX. So here is my response to this question.
C is for color or colour for those outside the U.S. And what might the X stand for? Well,
eXtra color obviously. Or perhaps it suggests that it is
eXciting and new. As you can see from picture, it is
eXtra thin. It is flatter than many cell phones. I put it on the table next to a blackberry and they were about the same thickness. It is
It is
eXtra bright. With the backlit screen it makes it so much easier to read then its predecessor. The screen is so crisp and clear, students have commented that it is a better screen than their cell phone. Many teachers will especially enjoy that it has
eXtra battery life. No longer will teachers or students need to replace the AAA batteries. It doesn't use any. It can run for weeks without needing recharged. When it does need recharged, this can be done with the wall charger that comes with the purchase, or the mini USB can be connected via a wire to the USB of a computer, OR it can be docked into a CX docking station, OR it will be charged from the Navigator cradles. Another extra is
eXtra memory. When I turn on my TI-Nspire CAS Touchpad and look at the status it says it has 27.8MB; the TI-Nspire CX CAS has 115.2MB. Maybe the X stands for
eXpandable. There is a special CX TI-Navigator Wireless Network Adapter that is yellow and sits atop the CX. This plugs into the new port on the top and has little metal 'grips' that are secured in the groves on the side. Our school has purchased through a couple of distributors over the past years, including Bach Company and School Mart. The latter says the CX Navigator hardware will be ready to ship in May. Another way to expand the TI-Nspire CX is with the Vernier Lab Cradle. This tool which will be available in April will enable data collection in ways that were not previously possible. Finally, I suggest that the TI-Nspire CX is
eXtra nice, because it plays well with others. The Lab Cradles work on any TI-Nspire. If you already have the TI-Nspire Navigator, those cradles fit really well on the CX and you can have a mixed class of Clickpads, Touchpads and CX. However, I would recommend only having a class of Touchpads or CX because all the buttons are in essentially the same location. I've heard many teachers and students who first get their hands on the CX exclaim how much they like the button on the new CX. They also quickly notice the responsiveness of CX's touchpad. That's right, it still uses the touchpad and is not a touchscreen. This means that it is still allowed on all the major tests. The TI-Nspire CX CAS is permitted on the PSAT, SAT, AP exams like AP Calculus, AP Statistics, AP Physics, AP Chemistry, etc. In addition to the above, the numeric TI-Nspire CX is permitted on the ACT and IB exams.
For those wondering, 'What is this information about a graphing calculator doing on a Godly Dominion blog?' I would answer both you and myself that technology, especially educational technology that seeks to "inspire all students to achieve to their potential and become innovators of tomorrow," is an integral part of the cultural mandate, or the dominion mandate, in Genesis 1:28.
And in the words of one of history's greatest mathematical physicists,
 classroom through the appropriate use of technology the CX brings some exciting improvements. Just yesterday I had a student ask what does the CX stand for in TI-Nspire CX. So here is my response to this question.
C is for color or colour for those outside the U.S. And what might the X stand for? Well,
eXtra color obviously. Or perhaps it suggests that it is
eXciting and new. As you can see from picture, it is
eXtra thin. It is flatter than many cell phones. I put it on the table next to a blackberry and they were about the same thickness.
 It is
It iseXtra bright. With the backlit screen it makes it so much easier to read then its predecessor. The screen is so crisp and clear, students have commented that it is a better screen than their cell phone. Many teachers will especially enjoy that it has
eXtra battery life. No longer will teachers or students need to replace the AAA batteries. It doesn't use any. It can run for weeks without needing recharged. When it does need recharged, this can be done with the wall charger that comes with the purchase, or the mini USB can be connected via a wire to the USB of a computer, OR it can be docked into a CX docking station, OR it will be charged from the Navigator cradles. Another extra is
eXtra memory. When I turn on my TI-Nspire CAS Touchpad and look at the status it says it has 27.8MB; the TI-Nspire CX CAS has 115.2MB. Maybe the X stands for
eXpandable. There is a special CX TI-Navigator Wireless Network Adapter that is yellow and sits atop the CX. This plugs into the new port on the top and has little metal 'grips' that are secured in the groves on the side.
 Our school has purchased through a couple of distributors over the past years, including Bach Company and School Mart. The latter says the CX Navigator hardware will be ready to ship in May. Another way to expand the TI-Nspire CX is with the Vernier Lab Cradle. This tool which will be available in April will enable data collection in ways that were not previously possible. Finally, I suggest that the TI-Nspire CX is
eXtra nice, because it plays well with others. The Lab Cradles work on any TI-Nspire. If you already have the TI-Nspire Navigator, those cradles fit really well on the CX and you can have a mixed class of Clickpads, Touchpads and CX. However, I would recommend only having a class of Touchpads or CX because all the buttons are in essentially the same location. I've heard many teachers and students who first get their hands on the CX exclaim how much they like the button on the new CX. They also quickly notice the responsiveness of CX's touchpad. That's right, it still uses the touchpad and is not a touchscreen. This means that it is still allowed on all the major tests. The TI-Nspire CX CAS is permitted on the PSAT, SAT, AP exams like AP Calculus, AP Statistics, AP Physics, AP Chemistry, etc. In addition to the above, the numeric TI-Nspire CX is permitted on the ACT and IB exams.
For those wondering, 'What is this information about a graphing calculator doing on a Godly Dominion blog?' I would answer both you and myself that technology, especially educational technology that seeks to "inspire all students to achieve to their potential and become innovators of tomorrow," is an integral part of the cultural mandate, or the dominion mandate, in Genesis 1:28.
And in the words of one of history's greatest mathematical physicists,
“Almighty God, who hast created man in Thine own image, and made him a living soul that he might seek after Thee and have dominion over Thy creatures, teach us to study the works of Thy hands that we may subdue the earth to our use, and strengthen our reason for Thy service; and so to receive Thy blessed Word, that we may believe on Him whom Thou has sent to give us the knowledge of salvation and the remission of sins. All which we ask in the name of the same Jesus Christ our Lord.” - James Clerk Maxwell (1831-1879)
Saturday, March 12, 2011
TI-Nspire CX at T-cubed in San Antonio
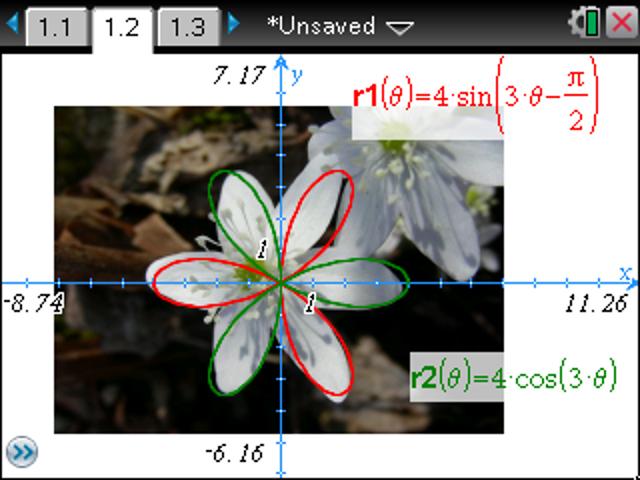
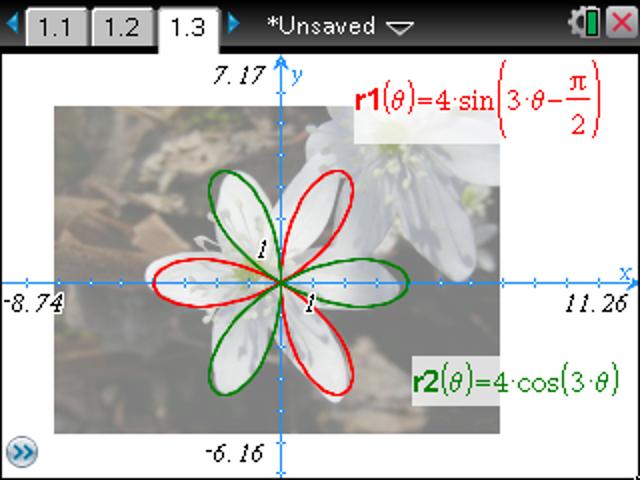
 At the recent Teachers Teaching with Technology International Conference in San Antonio, I had a great time seeing friends and new technology that will be a blessing to the math and science classroom. There have been questions about how clear is the CX color and backlit screen. To the right you can see a picture I took with my camera. The picture of the flowers were taken by my daughter Lydia in our backyard. This gives new meaning to graphing and rotating a polar 'rose.'
Inserting images makes mathematical modeling a lot more fun. I was showing the picture of the Alamo with the equations on it to a TI-Nspire Online User Group (The next meeting is April 14.), when someone asked about how the circle was draw. When you are on a Graphs or Geometry page you can press menu > Shapes > Circle.
 After the circle is draw, you press menu > Actions > Coordinates and Equation and click the circle to show the equation of the circle. I like to move my cursor over the circle and press ctrl menu for right-click and choose Coordinates and Equation. Showing the coordinate or equation is a feature that can be turned off by teachers who do not want students to have access to this. To do this they would use Press-to-Test.
Not that too many high school teachers use 3D by graphing z(x,y), but there is definitely a lot of excitement about this functionality on the TI-Nspire. It is so much more powerful than what was available with the TI-89. When z1(x,y)=x^2+y^2 is entered in the 3D graph view, a paraboloid is almost immediately rendered. This used to take a lot more computing time on the 89. Then something the 89 couldn't do, graph another 3D graph on top of that and z-trace. Auto-rotate by pressing A or just use the arrows.
Here is a video of a 3D graph that is rotated.
 I guess I need a better video camera if I want to do any future videos like this. To the right is a much better picture of what the heart looked like on the TI-Nspire CX handheld. (Here is a link for more graphs of hearts.) I was showing this to some middle school students last night. My oldest daughter was begging me to show her friends the CX. Some of her basketball teammates were spending the night on Friday before they went on a service project on Saturday morning. This group of girls said they had never heard of a z-axis. By easily changing the orientation of the axis by pressing x, y, and z or rotating using the arrows, it was fun to watch the 'light bulbs' turn in in their minds. They were so excited about math and learning some things their teachers hadn't taught them. They were exploring and explaining to each other what the z-axis was. With color, images, and fun 3D shapes, math becomes a lot more cool, even for 8th grade girls at a sleep over.
Yes, 3D and the new differential equations graph type, now enabling the drawing of slope fields from anywhere - even the Scratchpad, will be features that are available for the CAS or numeric TI-Nspire or TI-Nspire CX when they upgrade to 3.0.
Subscribe to:
Posts (Atom)
